Answered step by step
Verified Expert Solution
Question
1 Approved Answer
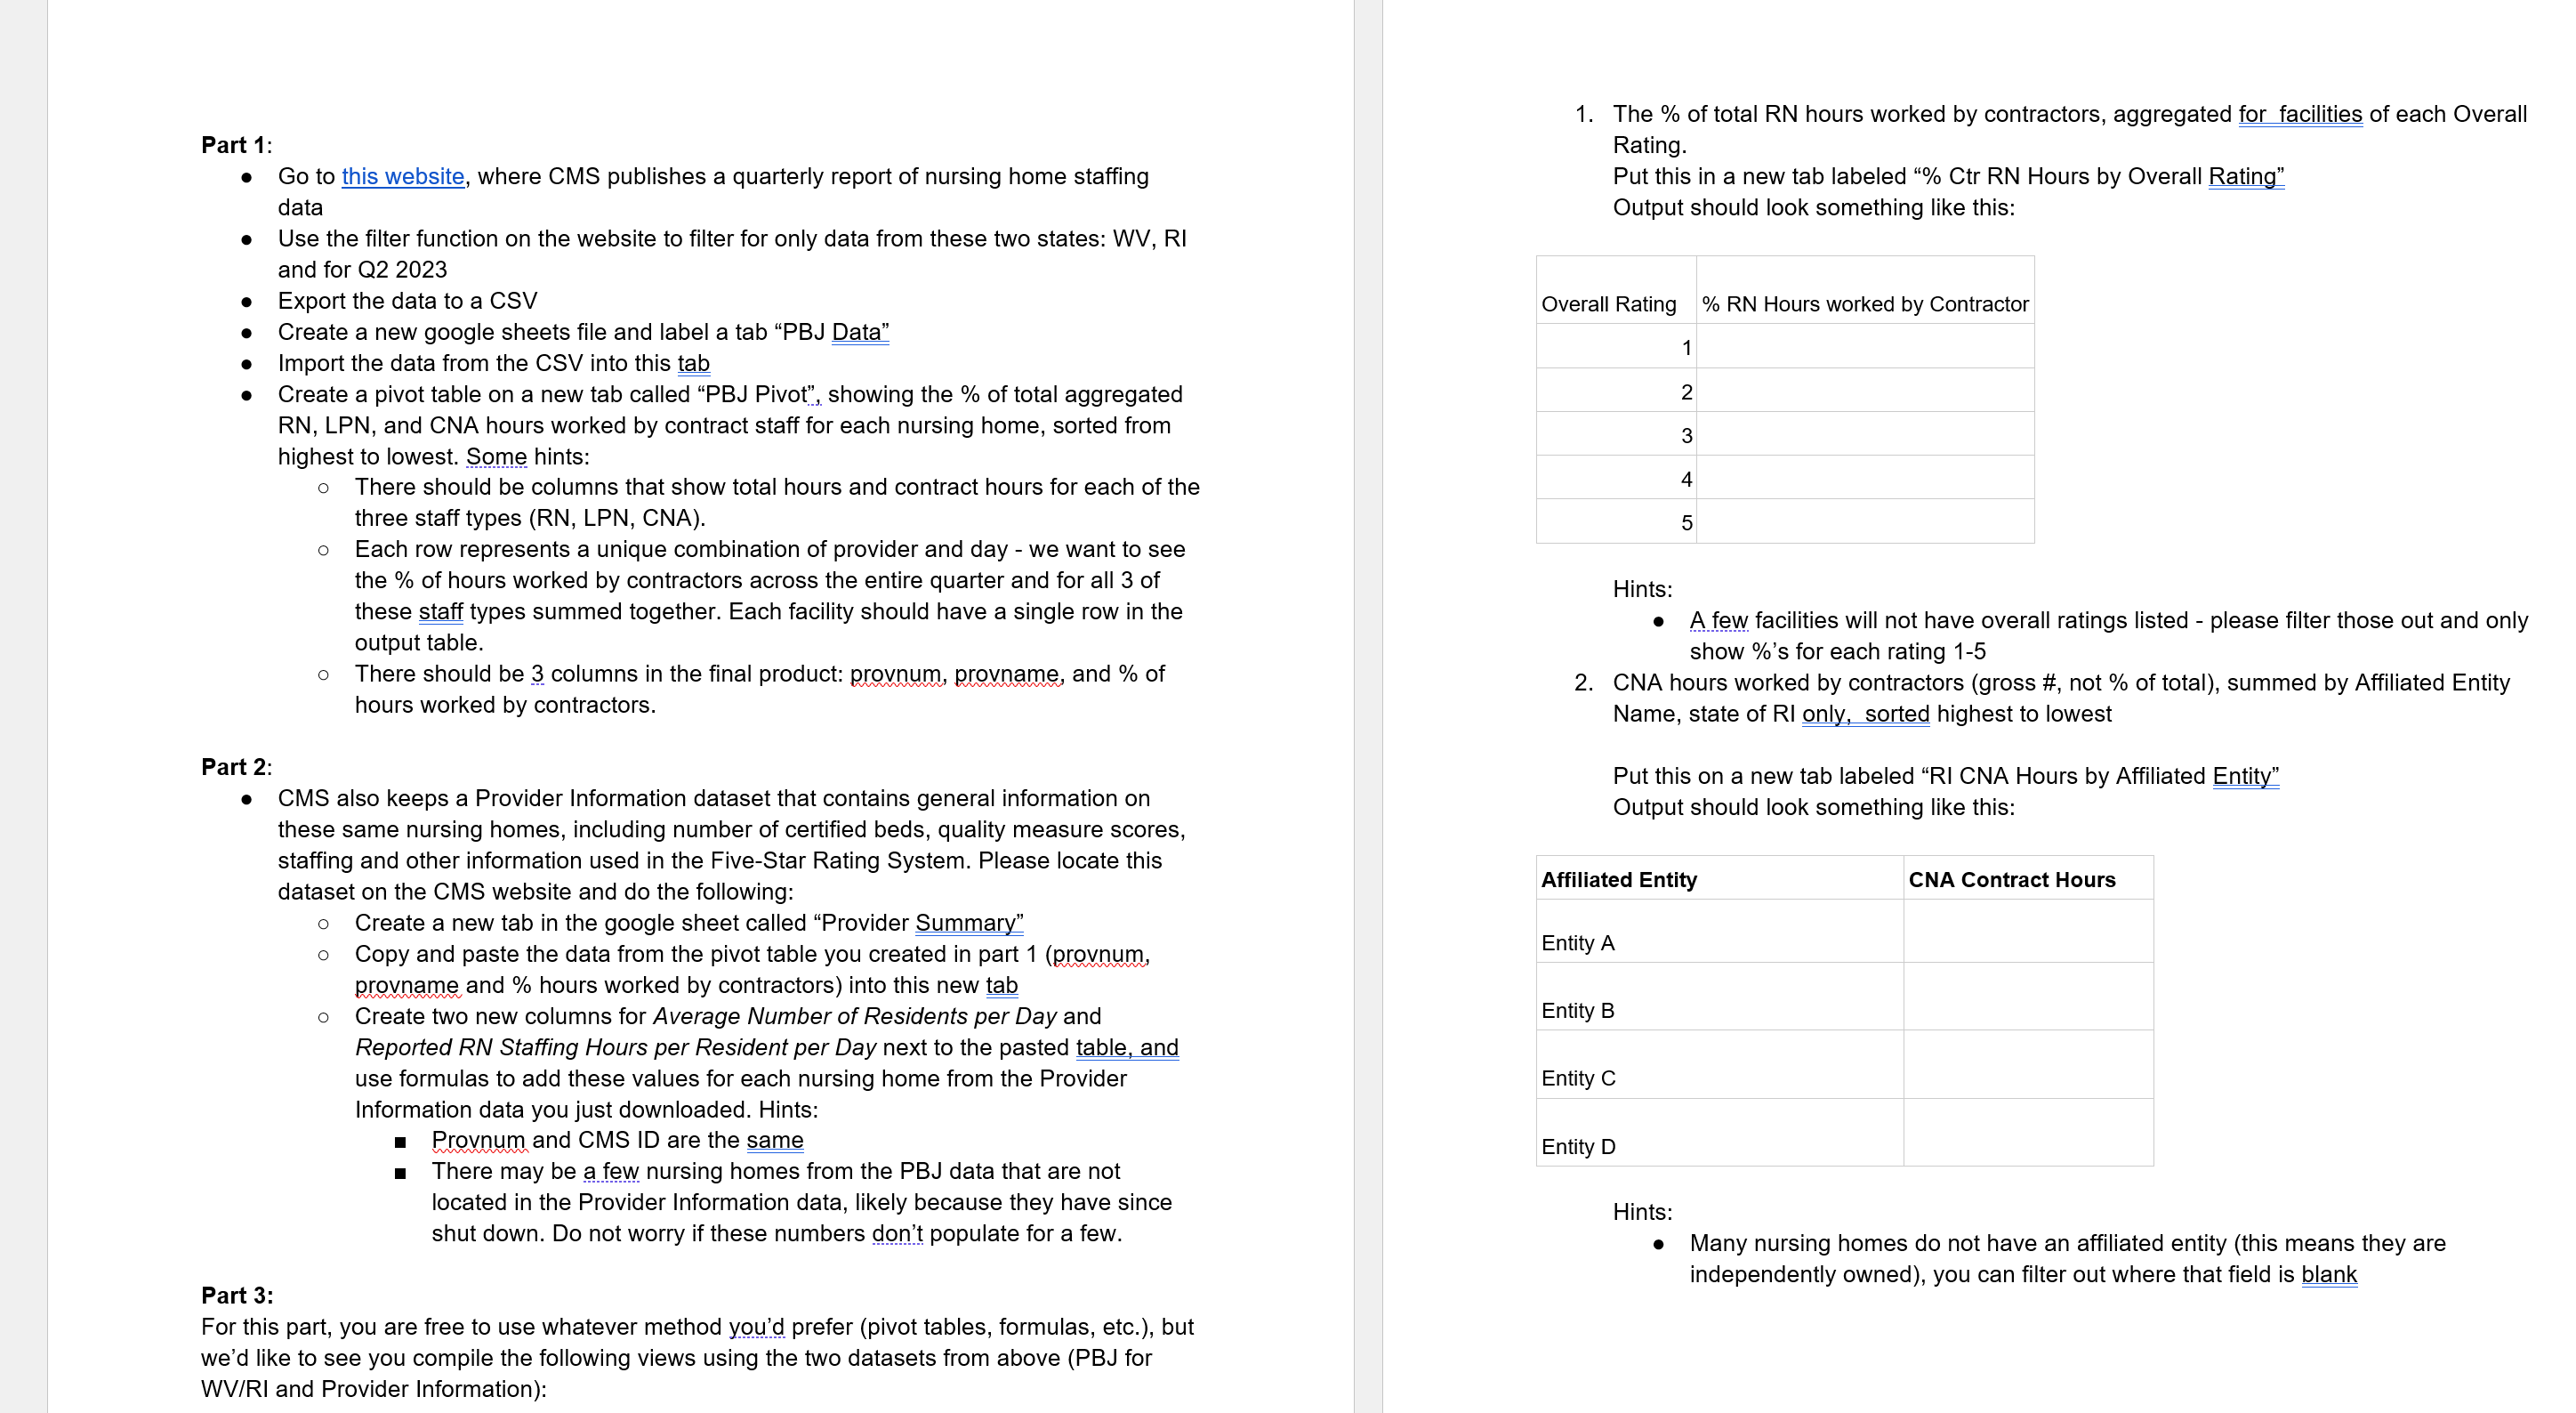
Part 1 : Go to this website, where CMS publishes a quarterly report of nursing home staffing data Use the filter function on the website
Part :
Go to this website, where CMS publishes a quarterly report of nursing home staffing
data
Use the filter function on the website to filter for only data from these two states: WV RI
and for Q
Export the data to a CSV
Create a new google sheets file and label a tab PBJ Data"
Import the data from the CSV into this tab
Create a pivot table on a new tab called PBJ Pivot", showing the of total aggregated
RN LPN and CNA hours worked by contract staff for each nursing home, sorted from
highest to lowest. Some hints:
There should be columns that show total hours and contract hours for each of the
three staff types RN LPN CNA
Each row represents a unique combination of provider and day we want to see
the of hours worked by contractors across the entire quarter and for all of
these staff types summed together. Each facility should have a single row in the
output table.
There should be columns in the final product: provnum, provname, and of
hours worked by contractors.
Part :
CMS also keeps a Provider Information dataset that contains general information on
these same nursing homes, including number of certified beds, quality measure scores,
staffing and other information used in the FiveStar Rating System. Please locate this
dataset on the CMS website and do the following:
Create a new tab in the google sheet called "Provider Summary"
Copy and paste the data from the pivot table you created in part provnum
provname and hours worked by contractors into this new tab
Create two new columns for Average Number of Residents per Day and
Reported RN Staffing Hours per Resident per Day next to the pasted table, and
use formulas to add these values for each nursing home from the Provider
Information data you just downloaded. Hints:
Provnum and CMS ID are the same
There may be a few nursing homes from the PBJ data that are not
located in the Provider Information data, likely because they have since
shut down. Do not worry if these numbers don't populate for a few.
Part :
For this part, you are free to use whatever method you'd prefer pivot tables, formulas, etc. but
we'd like to see you compile the following views using the two datasets from above PBJ for
WVRI and Provider Information:
The of total RN hours worked by contractors, aggregated for facilities of each Overall
Rating.
Put this in a new tab labeled Ctr RN Hours by Overall Rating"
Output should look something like this:
Hints:
A few facilities will not have overall ratings listed please filter those out and only
show s for each rating
CNA hours worked by contractors gross # not of total summed by Affiliated Entity
Name, state of RI only, sorted highest to lowest
Put this on a new tab labeled RI CNA Hours by Affiliated Entity"
Output should look something like this:
Hints:
Many nursing homes do not have an affiliated entity this means they are
independently owned you can filter out where that field is blank

Step by Step Solution
There are 3 Steps involved in it
Step: 1

Get Instant Access to Expert-Tailored Solutions
See step-by-step solutions with expert insights and AI powered tools for academic success
Step: 2

Step: 3

Ace Your Homework with AI
Get the answers you need in no time with our AI-driven, step-by-step assistance
Get Started


