Question
Part 1 In column M, calculate the value of the Best in Class bonus for each dealership (The dealership with the highest annual sales volume
Part 1
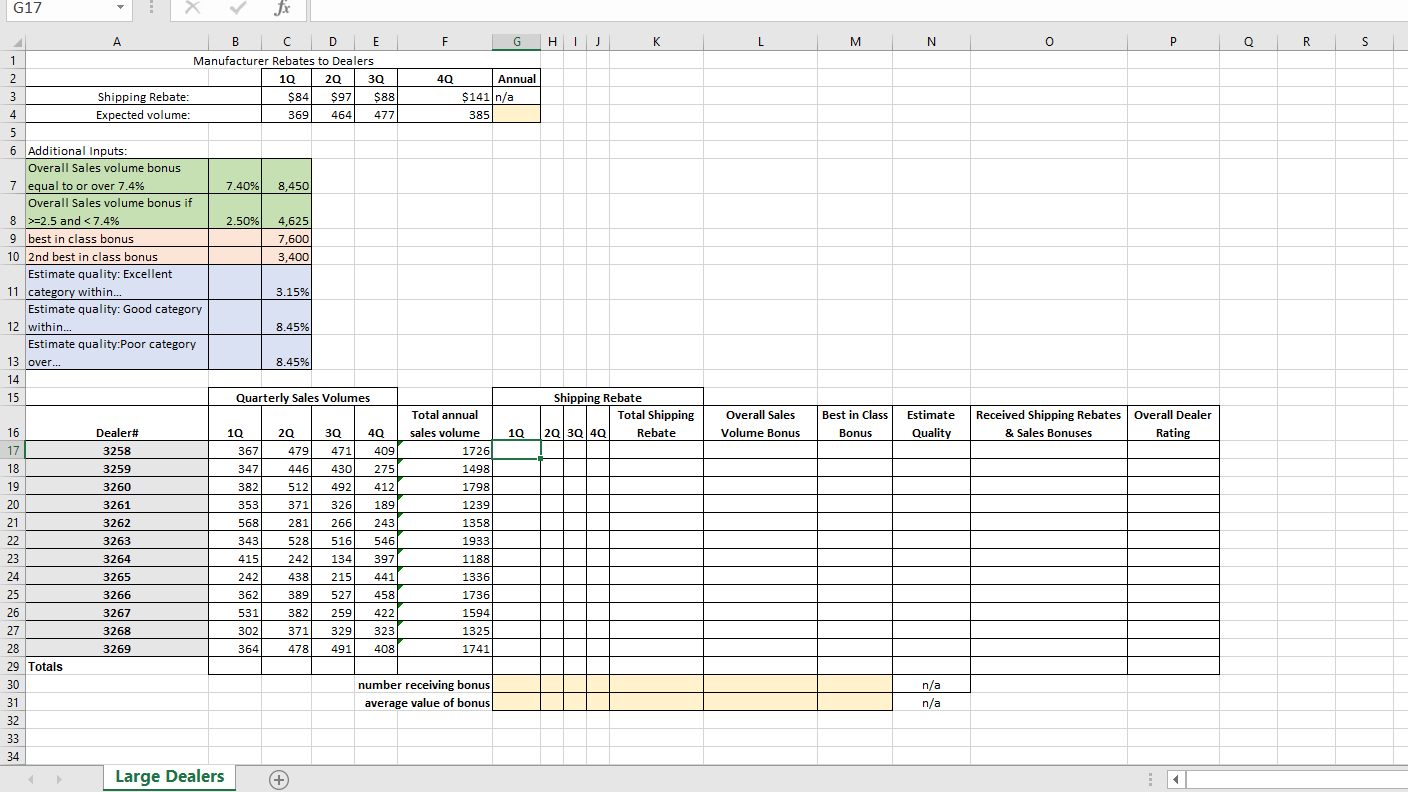
| In column M, calculate the value of the Best in Class bonus for each dealership (The dealership with the highest annual sales volume will receive the amount in cell C9 and the dealership with the 2nd highest annual sales volume will receive the amount in Cell C10. All others will receive $0). Hint: There are a few different ways that you can accomplish the Logical Argument of your IF statements for this one. Think through what your eyes/mind does when you look at the Total annual sales volume cells. You look at a number (F17 for example) to see if it is the largest in range right? Another way would be to think something like... "does this F17 number's rank equal to 1?" So... if it IS the largest they get the amount in C9. If it's not then you look to see if it is the SECOND largest. If it IS the 2nd largest number than they get the value in C10. If it is none of the above they get squat. *******A Best in Class bonus of $7,600 awarded to the one dealership with the highest overall (annual) sales volume in its class. A "2nd Best in Class" bonus of $3,400 is awarded to the dealership with the 2nd highest overall (annual) sales volume. You have been asked to set up a worksheet to record the dealer information for the past year and apply the appropriate promotions to each dealership. The actual dealership quarterly sales volumes have already been entered in a worksheet. Now, you will finalize the analysis. Part 2 Ken wants to compare the Total Annual Sales Volume for each dealer (in cells F17:F28) to Expected Annual Sales Volume in G4 to see how accurately they set their dealership quotas: In cell G4 sum the 4 quarterly expected volumes in cells C4:F4 together to obtain the Annual Expected Volume. In N17:N28 for each dealer analyze the quality of these volume expectations by comparing each dealers Total Annual Sales Volume to the Annual Expected Volume. Categorize the quality of the these comparisons into the following categories: Display Excellent if the actual volume is within 3.15% (=96.85%) of the expected sales volume in G4. (Hint: For example, if you wanted to determine if the value 26 is within +/ 25% of 40, you would need to test this value to make sure that both 26>=40.25*40 AND 26 |

Step by Step Solution
There are 3 Steps involved in it
Step: 1

Get Instant Access to Expert-Tailored Solutions
See step-by-step solutions with expert insights and AI powered tools for academic success
Step: 2

Step: 3

Ace Your Homework with AI
Get the answers you need in no time with our AI-driven, step-by-step assistance
Get Started


