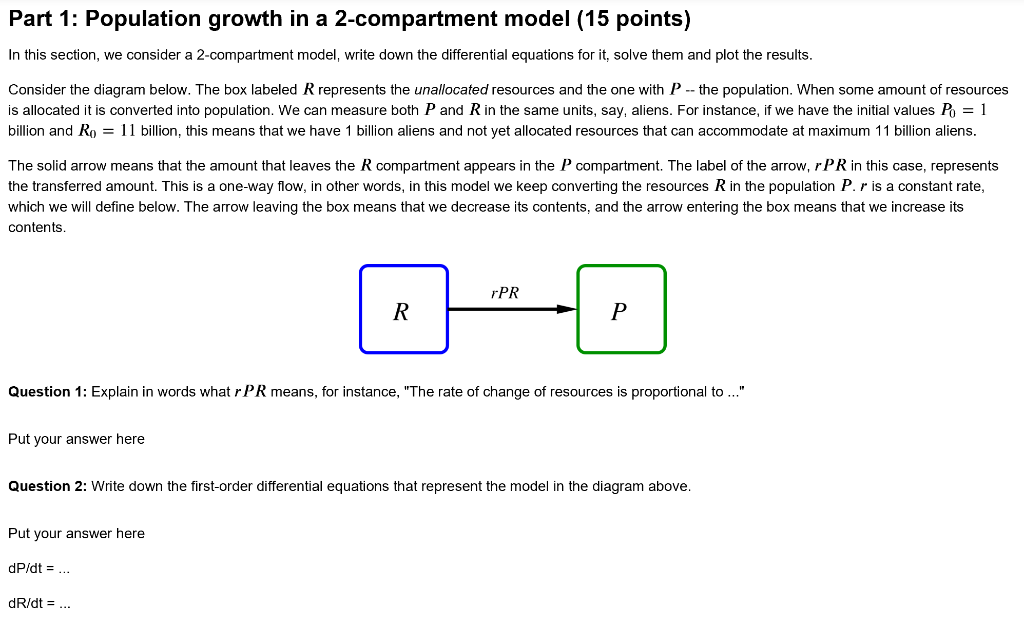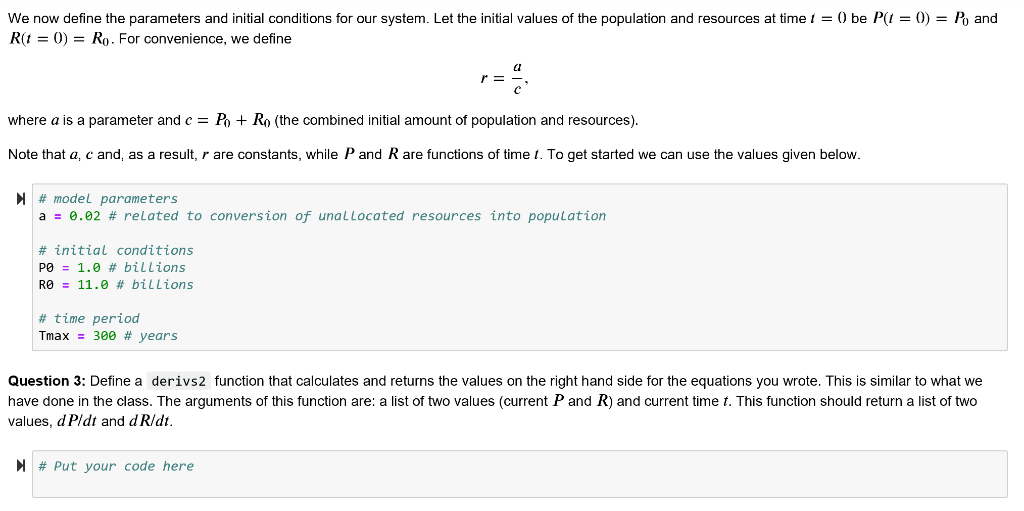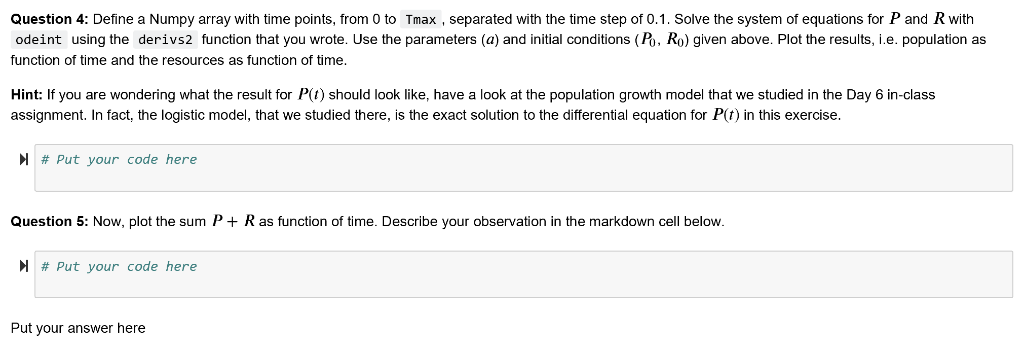


Part 1: Population growth in a 2-compartment model (15 points) In this section, we consider a 2-compartment model, write down the differential equations for it, solve them and plot the results Consider the diagram below. The box labeled R represents the unallocated resources and the one with Pthe population. When some amount of resources is allocated it is converted into population. We can measure both P and R in the same units, say, aliens. For instance, if we have the initial values P) = 1 billion and Ro 11 billion, this means that we have 1 billion aliens and not yet allocated resources that can accommodate at maximum 11 billion aliens. The solid arrow means that the amount that leaves the R compartment appears in the P compartment. The label of the arrow, rPR in this case, represents the transferred amount. This is a one-way flow, in other words, in this model we keep converting the resources R in the population P. r is a constant rate, which we will define below. The arrow leaving the box means that we decrease its contents, and the arrow entering the box means that we increase its contents rPR Question 1: Explain in words what r PR means, for instance, "The rate of change of resources is proportional to... Put your answer here Question 2: Write down the first-order differential equations that represent the model in the diagram above. Put your answer here dP/dt dR/dt We now define the parameters and initial conditions for our system. Let the initial values of the population and resources at time t R(t = 0) = Ro . For convenience, we define be P0 and CI rE where a is a parameter and cPo +Ro (the combined initial amount of population and resources) Note that a, c and, as a result, r are constants, while P and R are functions of time t. To get started we can use the values given below. # model parameters a-0.02 # related to conversion of una L Located resources into population # initial conditions P0-1.0 # billions RO 11.0 # billions # time period Tmax 300 # years Question 3: Define a derivs2 function that calculates and returns the values on the right hand side for the equations you wrote. This is similar to what we have done in the class. The arguments of this function are: a list of two values (current P and R) and current time t. This function should return a list of two values, d Pldt and d R/dt. # Put your code here Question 4: Define a Numpy array with time points, from 0 to Tmax , separated with the time step of 0.1. Solve the system of equations for P and R with odeint using the derivs2 function that you wrote. Use the parameters (a) and initial conditions (Po, Ro) given above. Plot the results, i.e. population as function of time and the resources as function of time Hint: If you are wondering what the result for P() should look like, have a look at the population growth model that we studied in the Day 6 in-class assignment. In fact, the logistic model, that we studied there, is the exact solution to the differential equation for P(t) in this exercise. # Put your code here Question 5: Now, plot the sum P R as function of time. Describe your observation in the markdown cell below. # Put your code here Put your answer here Part 1: Population growth in a 2-compartment model (15 points) In this section, we consider a 2-compartment model, write down the differential equations for it, solve them and plot the results Consider the diagram below. The box labeled R represents the unallocated resources and the one with Pthe population. When some amount of resources is allocated it is converted into population. We can measure both P and R in the same units, say, aliens. For instance, if we have the initial values P) = 1 billion and Ro 11 billion, this means that we have 1 billion aliens and not yet allocated resources that can accommodate at maximum 11 billion aliens. The solid arrow means that the amount that leaves the R compartment appears in the P compartment. The label of the arrow, rPR in this case, represents the transferred amount. This is a one-way flow, in other words, in this model we keep converting the resources R in the population P. r is a constant rate, which we will define below. The arrow leaving the box means that we decrease its contents, and the arrow entering the box means that we increase its contents rPR Question 1: Explain in words what r PR means, for instance, "The rate of change of resources is proportional to... Put your answer here Question 2: Write down the first-order differential equations that represent the model in the diagram above. Put your answer here dP/dt dR/dt We now define the parameters and initial conditions for our system. Let the initial values of the population and resources at time t R(t = 0) = Ro . For convenience, we define be P0 and CI rE where a is a parameter and cPo +Ro (the combined initial amount of population and resources) Note that a, c and, as a result, r are constants, while P and R are functions of time t. To get started we can use the values given below. # model parameters a-0.02 # related to conversion of una L Located resources into population # initial conditions P0-1.0 # billions RO 11.0 # billions # time period Tmax 300 # years Question 3: Define a derivs2 function that calculates and returns the values on the right hand side for the equations you wrote. This is similar to what we have done in the class. The arguments of this function are: a list of two values (current P and R) and current time t. This function should return a list of two values, d Pldt and d R/dt. # Put your code here Question 4: Define a Numpy array with time points, from 0 to Tmax , separated with the time step of 0.1. Solve the system of equations for P and R with odeint using the derivs2 function that you wrote. Use the parameters (a) and initial conditions (Po, Ro) given above. Plot the results, i.e. population as function of time and the resources as function of time Hint: If you are wondering what the result for P() should look like, have a look at the population growth model that we studied in the Day 6 in-class assignment. In fact, the logistic model, that we studied there, is the exact solution to the differential equation for P(t) in this exercise. # Put your code here Question 5: Now, plot the sum P R as function of time. Describe your observation in the markdown cell below. # Put your code here Put your answer here


