

Question
Part 1: Practice with the Big Ideas What proportion of parents feel hopeless when it comes to helping their children with math homework?An educational psychologist
Part 1: Practice with the Big Ideas
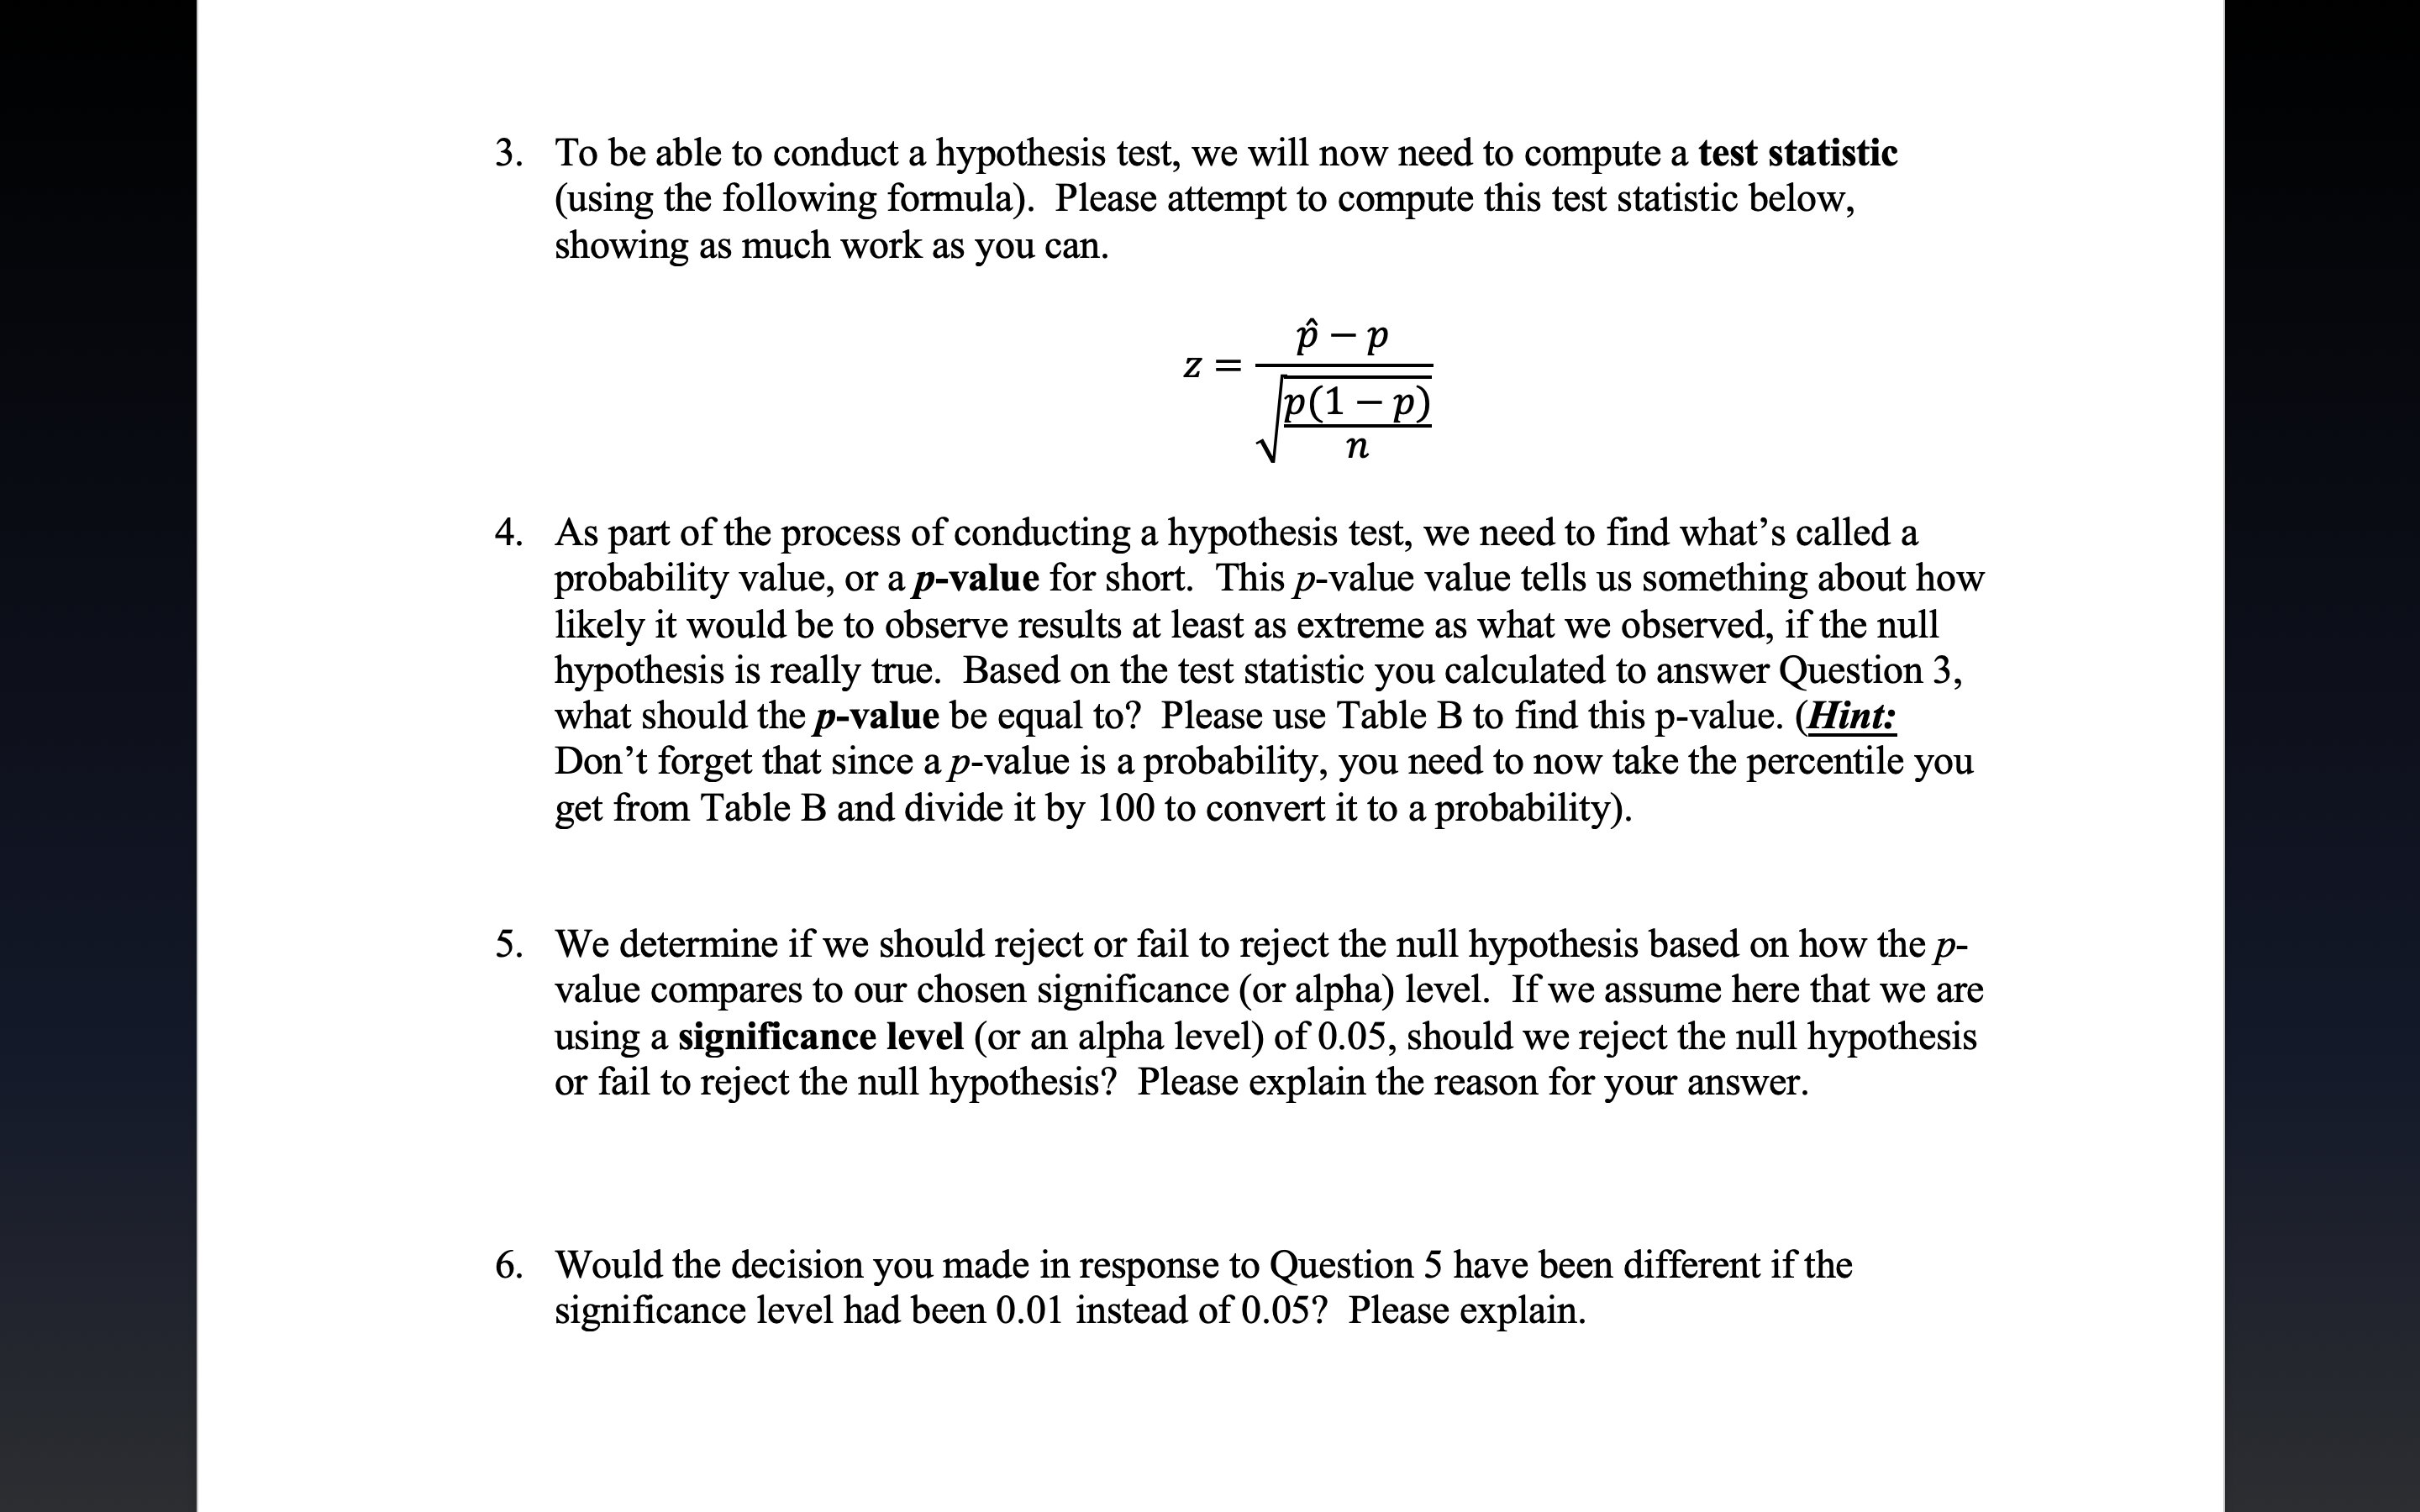
What proportion of parents feel hopeless when it comes to helping their children with math homework?An educational psychologist claims, based on extensive research, that 56% of parents feel hopeless when it comes to helping their children with math homework.Believing this claimed value is too high, another researcher surveys a random sample of 450 parents and finds that 232 of these parents say they feel hopeless when it comes to helping their children with math homework.If we want to use this information to conduct a hypothesis test, we need to begin with anull hypothesis(i.e., the initial claim being tested) and an alternative hypothesis (i.e., the competing hypothesis that illustrates what we think is really going on).In symbols, these hypotheses are as follows:
Ho:p= 0.56
Ha:p
1) Look carefully at the hypotheses above and answer the following questions about these hypotheses.
A.What does the symbol "p" stand for?
B.Why does the number "0.56" appear in both the null and alternative hypotheses?
C.Why is there a "" (or greater than) sign?
2) Remember that 232 out of a sample of 450 parents said they feel hopeless when it comes to helping their children with math homework.What will the sample proportion (or) be?Please compute this value below andround answer to three decimal places.
Step by Step Solution
There are 3 Steps involved in it
Step: 1

Get Instant Access to Expert-Tailored Solutions
See step-by-step solutions with expert insights and AI powered tools for academic success
Step: 2

Step: 3
Ace Your Homework with AI
Get the answers you need in no time with our AI-driven, step-by-step assistance
Get Started
Precalculus, Enhanced
Authors: Cynthia Y Young
3rd Edition
1119339510, 9781119339519