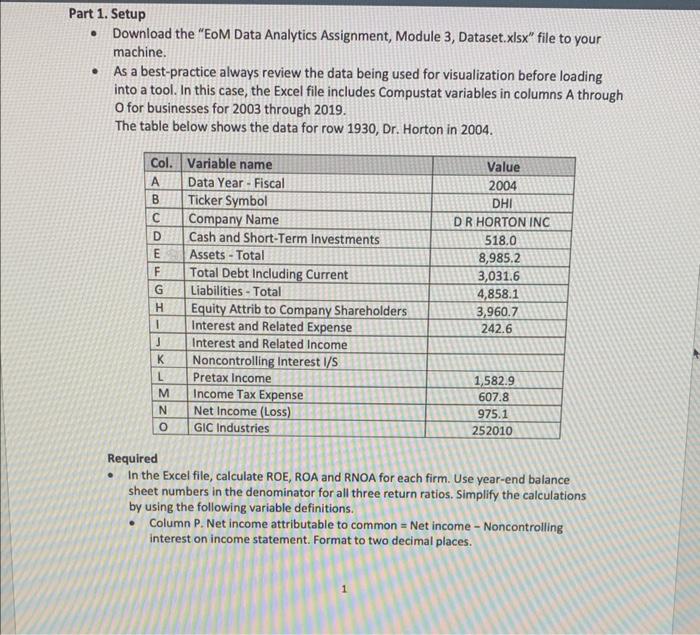
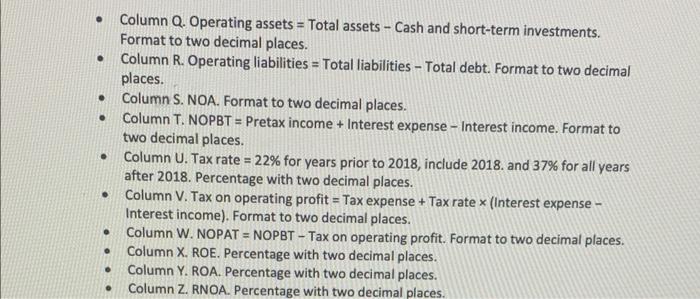
Part 1. Setup - Download the "EoM Data Analytics Assignment, Module 3, Dataset.xlsx" file to your machine. - As a best-practice always review the data being used for visualization before loading into a tool. In this case, the Excel file includes Compustat variables in columns A through O for businesses for 2003 through 2019. The table below shows the data for row 1930, Dr. Horton in 2004. Required - In the Excel file, calculate ROE, ROA and RNOA for each firm. Use year-end balance sheet numbers in the denominator for all three return ratios. Simplify the calculations by using the following variable definitions. - Column P. Net income attributable to common = Net income - Noncontrolling interest on income statement. Format to two decimal places. - Column Q. Operating assets = Total assets - Cash and short-term investments. Format to two decimal places. - Column R. Operating liabilities = Total liabilities - Total debt. Format to two decimal places. - Column S. NOA. Format to two decimal places. - Column T. NOPBT = Pretax income + Interest expense Interest income. Format to two decimal places. - Column U. Tax rate =22% for years prior to 2018 , include 2018 . and 37% for all years after 2018 . Percentage with two decimal places. - Column V. Tax on operating profit = Tax expense + Tax rate (Interest expense Interest income). Format to two decimal places. - Column W. NOPAT = NOPBT - Tax on operating profit. Format to two decimal places. - Column X. ROE. Percentage with two decimal places. - Column Y. ROA. Percentage with two decimal places. - Column Z. RNOA. Percentage with two decimal places. Part 1. Setup - Download the "EoM Data Analytics Assignment, Module 3, Dataset.xlsx" file to your machine. - As a best-practice always review the data being used for visualization before loading into a tool. In this case, the Excel file includes Compustat variables in columns A through O for businesses for 2003 through 2019. The table below shows the data for row 1930, Dr. Horton in 2004. Required - In the Excel file, calculate ROE, ROA and RNOA for each firm. Use year-end balance sheet numbers in the denominator for all three return ratios. Simplify the calculations by using the following variable definitions. - Column P. Net income attributable to common = Net income - Noncontrolling interest on income statement. Format to two decimal places. - Column Q. Operating assets = Total assets - Cash and short-term investments. Format to two decimal places. - Column R. Operating liabilities = Total liabilities - Total debt. Format to two decimal places. - Column S. NOA. Format to two decimal places. - Column T. NOPBT = Pretax income + Interest expense Interest income. Format to two decimal places. - Column U. Tax rate =22% for years prior to 2018 , include 2018 . and 37% for all years after 2018 . Percentage with two decimal places. - Column V. Tax on operating profit = Tax expense + Tax rate (Interest expense Interest income). Format to two decimal places. - Column W. NOPAT = NOPBT - Tax on operating profit. Format to two decimal places. - Column X. ROE. Percentage with two decimal places. - Column Y. ROA. Percentage with two decimal places. - Column Z. RNOA. Percentage with two decimal places