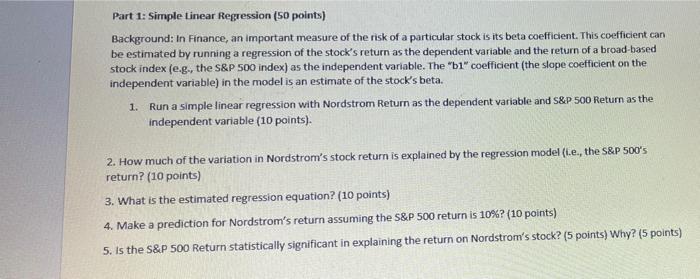
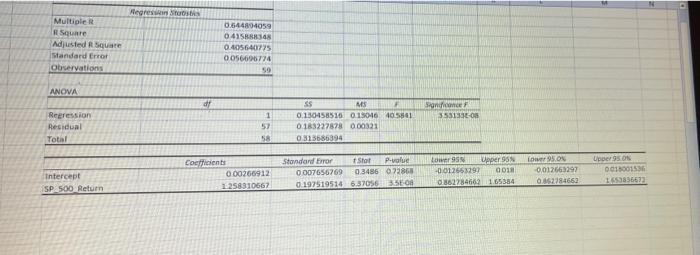
Part 1: Simple Linear Regression (50 points) Background: In Finance, an important measure of the risk of a particular stock is its beta coefficient. This coefficient can be estimated by running a regression of the stock's return as the dependent variable and the return of a broad-based stock index (eg, the S&P 500 index) as the independent variable. The "b1" coefficient (the slope coefficient on the independent variable) in the model is an estimate of the stock's beta. 1. Run a simple linear regression with Nordstrom Return as the dependent variable and S&P 500 Return as the independent variable (10 points). 2. How much of the variation in Nordstrom's stock return is explained by the regression model (t.e., the S&P 500's return? (10 points) 3. What is the estimated regression equation? (10 points) 4. Make a prediction for Nordstrom's return assuming the S&P 500 return is 10%? (10 points) 5. Is the S&P 500 Return statistically significant in explaining the return on Nordstrom's stock? (5 points) Why? points) Negreste Multiple Square Adjusted Square Standard Error Observations 6.544804059 04158 0.405640775 0056606774 50 ANOVA df Son 353133E-ON Regression Residual Total 1 57 58 ss MS 0.130458516 01501640561 0183227878 0.00321 0.323686394 Coefficients 0.00266912 1.258310667 Standard Error Stot P-value 0007656769 0.3486 07286 0.197519514 6.37056 35-O Intercept SP_500_ Return Lower per 95N -0.012653291 GO 0862784662 165384 Lower 95 ON 0,012663297 0.862784662 Upper SON 0011001536 Part 1: Simple Linear Regression (50 points) Background: In Finance, an important measure of the risk of a particular stock is its beta coefficient. This coefficient can be estimated by running a regression of the stock's return as the dependent variable and the return of a broad-based stock index (eg, the S&P 500 index) as the independent variable. The "b1" coefficient (the slope coefficient on the independent variable) in the model is an estimate of the stock's beta. 1. Run a simple linear regression with Nordstrom Return as the dependent variable and S&P 500 Return as the independent variable (10 points). 2. How much of the variation in Nordstrom's stock return is explained by the regression model (t.e., the S&P 500's return? (10 points) 3. What is the estimated regression equation? (10 points) 4. Make a prediction for Nordstrom's return assuming the S&P 500 return is 10%? (10 points) 5. Is the S&P 500 Return statistically significant in explaining the return on Nordstrom's stock? (5 points) Why? points) Negreste Multiple Square Adjusted Square Standard Error Observations 6.544804059 04158 0.405640775 0056606774 50 ANOVA df Son 353133E-ON Regression Residual Total 1 57 58 ss MS 0.130458516 01501640561 0183227878 0.00321 0.323686394 Coefficients 0.00266912 1.258310667 Standard Error Stot P-value 0007656769 0.3486 07286 0.197519514 6.37056 35-O Intercept SP_500_ Return Lower per 95N -0.012653291 GO 0862784662 165384 Lower 95 ON 0,012663297 0.862784662 Upper SON 0011001536


