Answered step by step
Verified Expert Solution
Link Copied!

Question

1 Approved Answer

Part 2. Conducting a Chi-Square Test (15 points) 1. In the RCT by Knight et al, 70 patients were randomized to a Mediterranean diet and

Part 2. Conducting a Chi-Square Test (15 points)

1.In the RCT by Knight et al, 70 patients were randomized to a Mediterranean diet and 67 were randomized to the control diet. Table 1 shows that 33 of the patients randomized to the Mediterranean diet were women compared to 40 randomized to the control diet. Construct a 2x2 table of the observed counts of gender by diet. Include row and column totals. (6 points: 2 pts for correctly labeling columns/rows, 2 pts for marginal/totals, 0.5 pt per observed count)

2.Construct a 2x2 table of the expected counts of gender by diet. Briefly compare the expected frequencies to the observed frequencies and summarize your results. (3 points: 0.5 pt per cell, 1 pt interpretation)

3.Calculate the chi-square statistic and conduct a chi-square test to determine if there is a significant relationship between gender and diet. State the null and alternative hypotheses, whether the conditions of the chi-square test are met, and your p-value. What do you conclude? (6 points: 2 pts hypotheses, 1 pt assumptions/conditions, 1 pt chi-square statistic, 1 pt p-value, 1 pt interpretation)
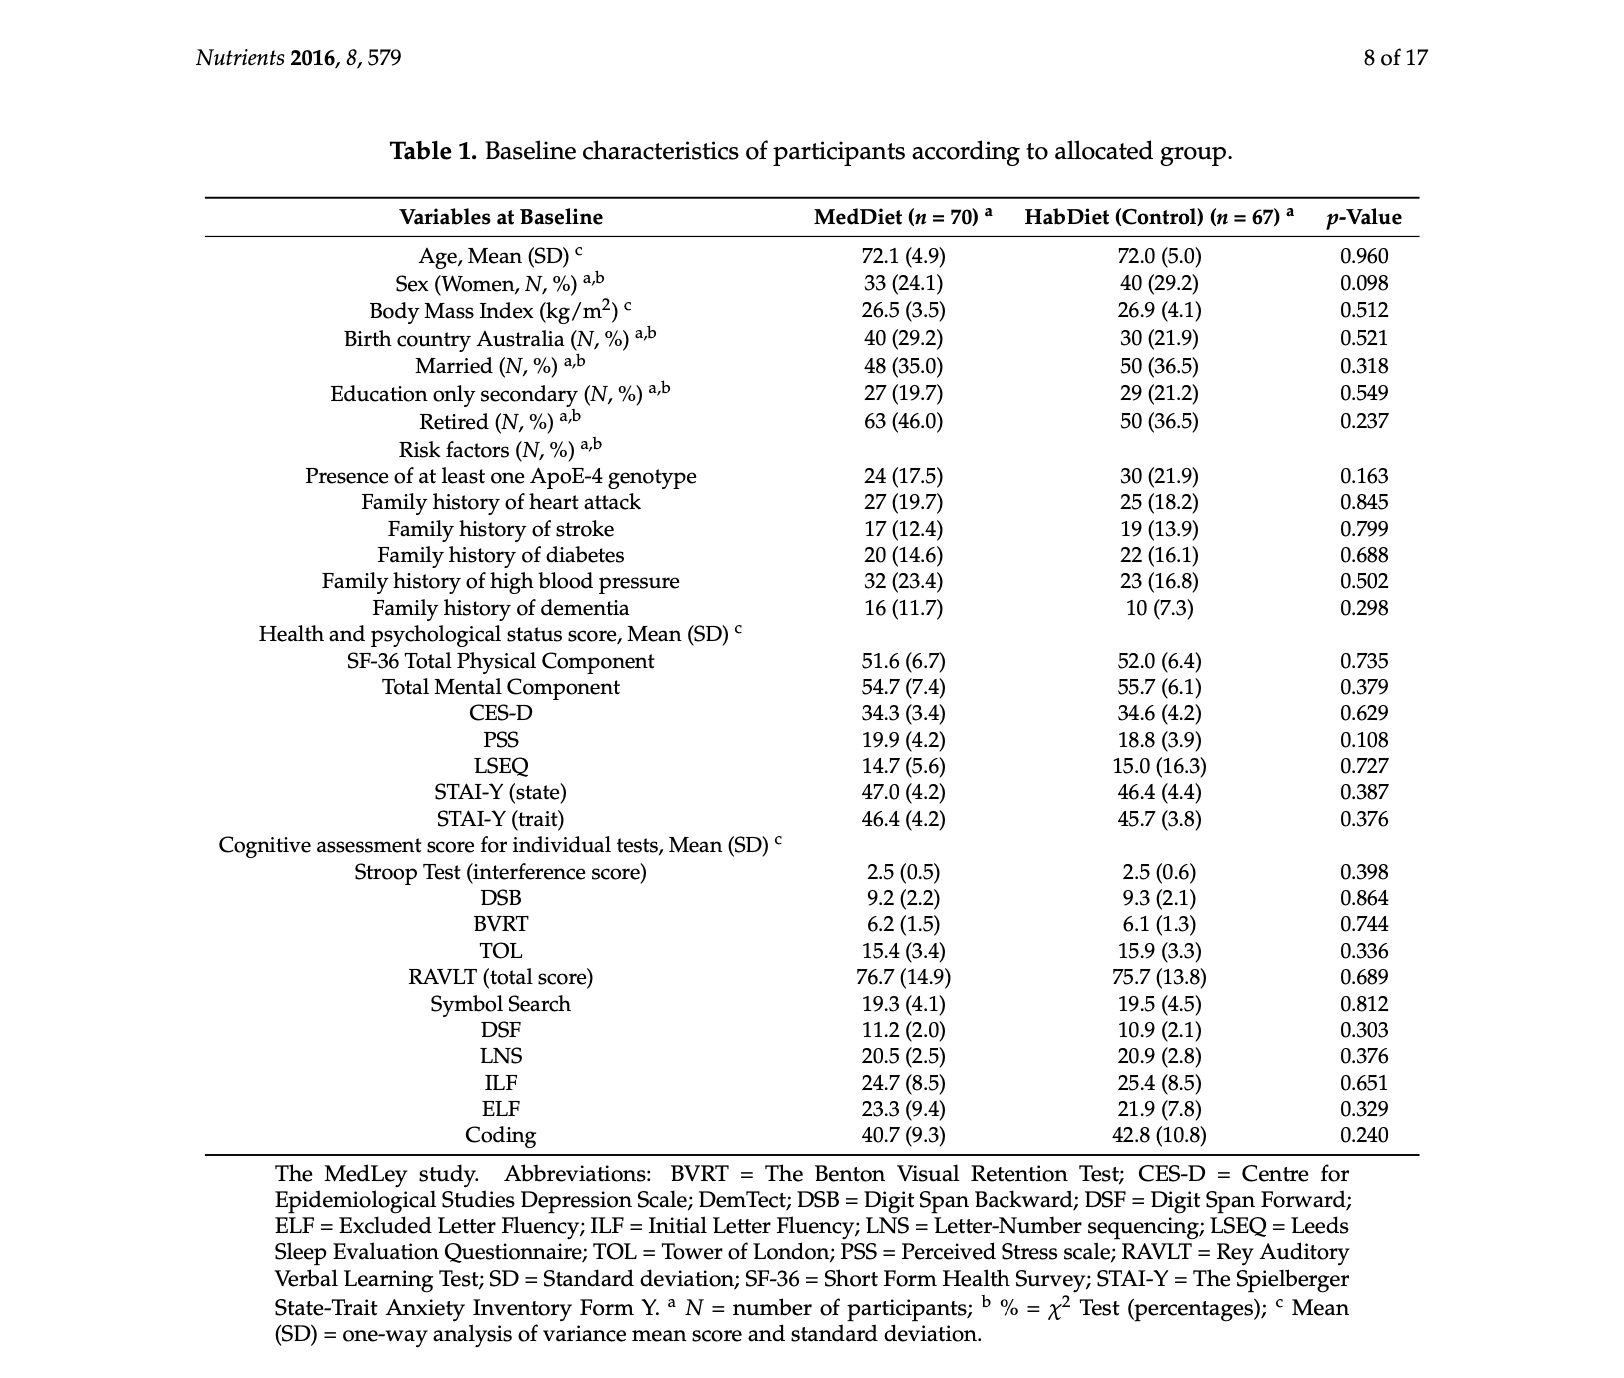
image text in transcribed
Nutrients 2016, 8, 579 8 of 17 Table 1. Baseline characteristics of participants according to allocated group. Variables at Baseline MedDiet (n = 70) a HabDiet (Control) (n = 67) a p-Value Age, Mean (SD) 0.960 Sex (Women, N, %) a,b 72.1 (4.9) 72.0 (5.0) 33 (24.1) 40 (29.2) 0.098 Body Mass Index (kg/m2) c 26.5 (3.5) 26.9 (4.1) 0.512 Birth country Australia (N, %) a,b 40 (29.2) 30 (21.9) 0.521 Married (N, %) a,b 48 (35.0) 50 (36.5) 0.318 Education only secondary (N, %) a,b 27 (19.7) 29 (21.2) 0.549 Retired (N, %) a,b 63 (46.0) 50 (36.5) 0.237 Risk factors (N, %) a,b Presence of at least one ApoE-4 genotype 24 (17.5) 30 (21.9) 0.163 Family history of heart attack 27 (19.7) 25 (18.2 ) 0.845 Family history of stroke 17 (12.4) 19 (13.9) 0.799 Family history of diabetes 20 (14.6) 22 (16.1) 0.688 Family history of high blood pressure 32 (23.4) 23 (16.8) 0.502 Family history of dementia Health and psychological status score, Mean (SD) c 16 (11.7) 10 (7.3) 0.298 SF-36 Total Physical Component 51.6 (6.7) 52.0 (6.4) 0.735 Total Mental Component 54.7 (7.4) 55.7 (6.1) 0.379 CES-D 34.3 (3.4) 34.6 (4.2) 0.629 PSS 19.9 (4.2) 18.8 (3.9) 0.108 LSEQ 14.7 (5.6) 15.0 (16.3) 0.727 STAI-Y (state) 47.0 (4.2) 46.4 (4.4) 0.387 STAI-Y (trait) 46.4 (4.2) 45.7 (3.8) 0.376 Cognitive assessment score for individual tests, Mean (SD) c Stroop Test (interference score) 2.5 (0.5) 2.5 (0.6) 0.398 DSB 9.2 (2.2) 9.3 (2.1) 0.864 BURT 6.2 (1.5) 6.1 (1.3) 0.744 TOL 15.4 (3.4) 15.9 (3.3) 0.336 RAVLT (total score) 76.7 (14.9) 75.7 (13.8) 0.689 Symbol Search 19.3 (4.1) 19.5 (4.5) 0.812 DSF 11.2 (2.0) 10.9 (2.1) 0.303 LNS 20.5 (2.5) 20.9 (2.8) 0.376 ILF 24.7 (8.5) 25.4 (8.5) 0.651 ELF 23.3 (9.4) 21.9 (7.8) 0.329 Coding 40.7 (9.3) 42.8 (10.8) 0.240 The MedLey study. Abbreviations: BVRT = The Benton Visual Retention Test; CES-D = Centre for Epidemiological Studies Depression Scale; Dem Tect; DSB = Digit Span Backward; DSF = Digit Span Forward; ELF = Excluded Letter Fluency; ILF = Initial Letter Fluency; LNS = Letter-Number sequencing; LSEQ = Leeds Sleep Evaluation Questionnaire; TOL = Tower of London; PSS = Perceived Stress scale; RAVLT = Rey Auditory Verbal Learning Test; SD = Standard deviation; SF-36 = Short Form Health Survey; STAI-Y = The Spielberger State-Trait Anxiety Inventory Form Y. a N = number of participants; b % = x2 Test (percentages); Mean (SD) = one-way analysis of variance mean score and standard deviation

Step by Step Solution

There are 3 Steps involved in it

Step: 1

blur-text-image

Get Instant Access to Expert-Tailored Solutions

See step-by-step solutions with expert insights and AI powered tools for academic success

Step: 2

blur-text-image

Step: 3

blur-text-image

Ace Your Homework with AI

Get the answers you need in no time with our AI-driven, step-by-step assistance

Get Started

Recommended Textbook for

An Introduction to Measure Theoretic Probability

Authors: George G. Roussas

2nd edition

128000422, 978-0128000427

More Books

Students also viewed these Mathematics questions