

Answered step by step
Verified Expert Solution
Question
1 Approved Answer
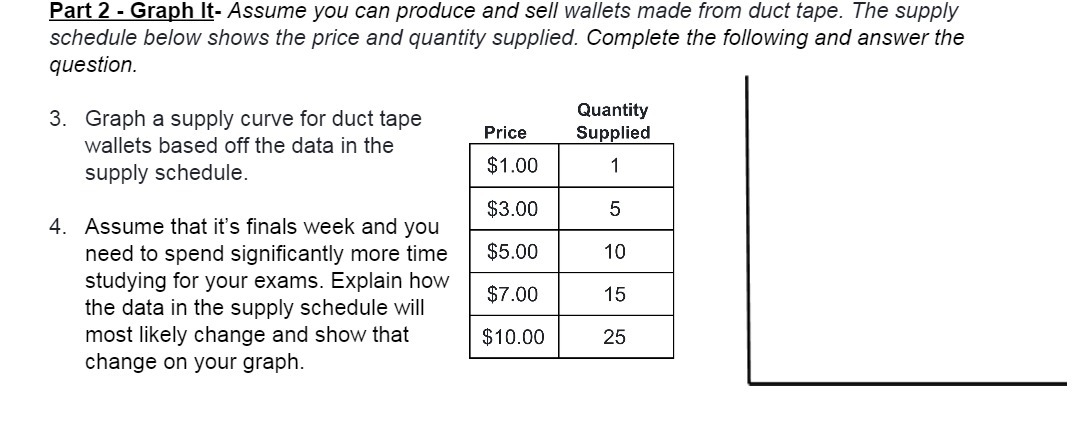
Part 2 - Graph It- Assume you can produce and sell wallets made from duct tape. The supply schedule below shows the price and quantity
Step by Step Solution
There are 3 Steps involved in it
Step: 1

Get Instant Access to Expert-Tailored Solutions
See step-by-step solutions with expert insights and AI powered tools for academic success
Step: 2

Step: 3
Ace Your Homework with AI
Get the answers you need in no time with our AI-driven, step-by-step assistance
Get Started
Managerial economics applications strategy and tactics
Authors: James r. mcguigan, R. Charles Moyer, frederick h. deb harris
12th Edition
9781133008071, 1439079234, 1133008070, 978-1439079232