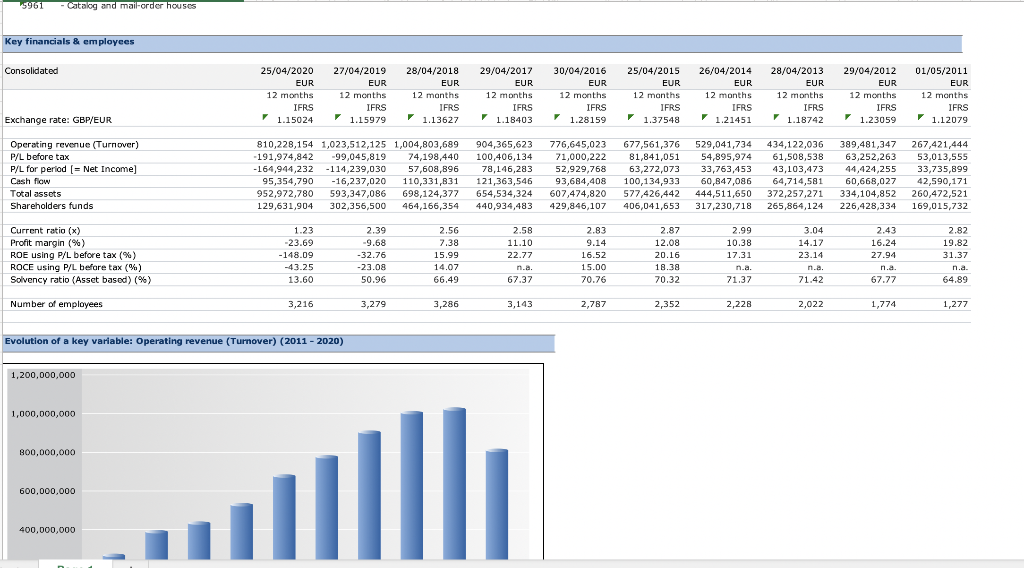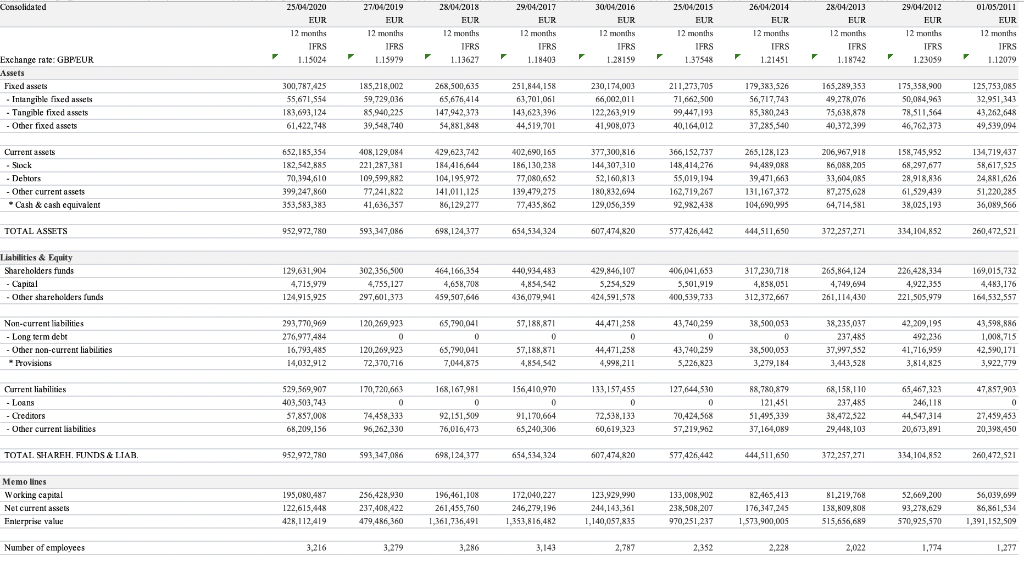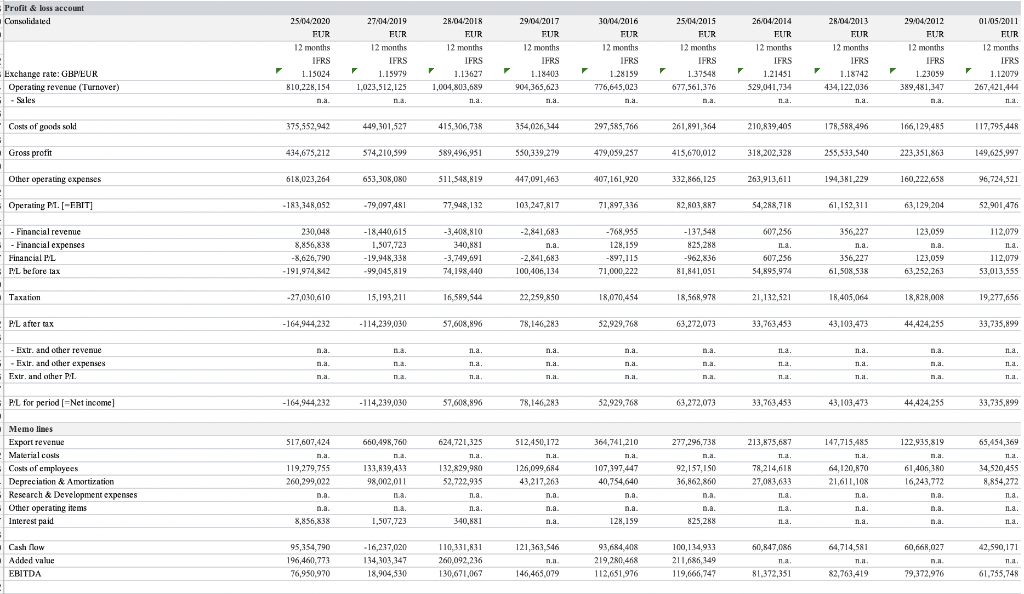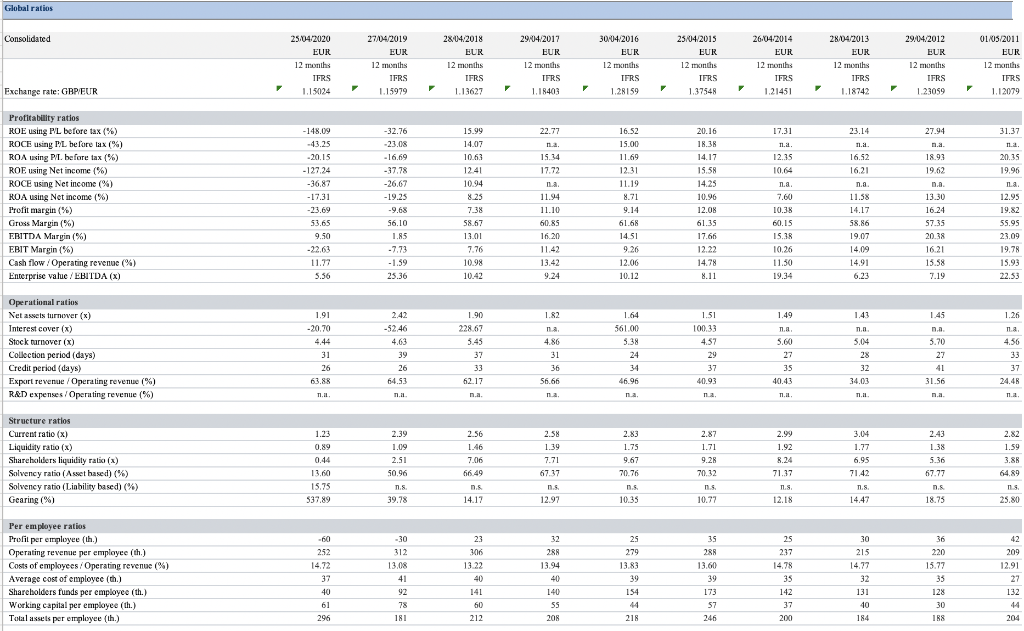


Part 2 Look at the balance sheet and accounts data provided in the 'Materials', 'Part 2'. Analyse and discuss the financial performance of the company and its ability to create and capture value. 15961 - Catalog and mail-order houses - Key financials & employees Consolidated 25/04/2020 EUR 12 months IFRS 1.15024 27/04/2019 EUR 12 months IFRS 1.15979 28/04/2018 EUR 12 months IFRS 1.13627 29/04/2017 EUR 12 months IFRS 1.18403 30/04/2016 EUR 12 months IFRS 1.28159 25/04/2015 EUR 12 months IFRS 26/04/2014 EUR 12 months IFRS 1.21451 28/04/2013 EUR 12 months IFRS 1.18742 29/04/2012 EUR 12 months IFRS 1.23059 01/05/2011 EUR 12 months IFRS 1.12079 Exchange rate: GBP/EUR 1.37548 Operating revenue (Turnover) P/L before tax P/L for period (= Net Income] Cash flow Total assets Shareholders funds 810,228,154 1,023,512,125 1,004,803,689 -191,974,842 -99,045,819 74,198,440 -164,944,232 - 114,239,030 57,608,896 95,354,790 -16,237,020 110,331,831 952,972,780 593,347,086 698,124,377 129,631,904 302,356,500 464,166,354 904,365,623 100,406,134 78,146,283 121,363,546 654,534,324 440,934,483 776,645,023 71,000,222 52,929,768 93,684,408 607,474,820 429,846,107 677,561,376 81,841,051 63,272,073 100,134,933 577,426,442 406,041,653 529,041,734 54,895,974 33,763,453 60,847,086 444,511,650 317,230,718 434,122,036 61,508,538 43,103,473 64,714,581 372,257,271 265,864,124 389,481,347 63,252,263 44,424,255 60,668,027 334,104,852 226,428,334 267,421,444 53.013,555 33,735,899 42,590,171 260,472,521 169,015,732 Current ratio (x) Profit margin (%) ROE using P/L before tax (%) ROCE using P/L before tax (%) Solvency ratio (Asset based) (%) 1.23 -23.69 -148.09 -43.25 13.60 2.39 -9.68 -32.76 -23.08 50.96 2.56 7.38 15.99 14.07 66.49 2.58 11.10 22.77 n.a. 67.37 2.83 9.14 16.52 15.00 70.76 2.87 12.08 20.16 18.38 70.32 2.99 10.38 17.31 n.a. 71.37 3.04 14.17 23.14 n.a. 71.42 2.43 16.24 27.94 2.82 19.82 31.37 67.77 64.89 Number of employees 3,216 3,279 3,286 3,143 2,787 2,352 2,228 2,022 1,774 1,277 Evolution of a key variable: Operating revenue (Turnover) (2011 - 2020) 1,200,000,000 1,000,000,000 800,000,000 600,000,000 400,000,000 Consolidated 25/04/2020 EUR 12 months IFRS 1.15024 27/04/2019 EUR 12 months IFRS 1.15979 28/04/2018 EUR 12 months IFRS 1.13627 29.04.2017 EUR 12 months IFRS 1.18403 30/04/2016 EUR 12 months IFRS 1.28159 25/04/2015 EUR 12 months IFRS 1.37548 26.04.2014 ELR 12 months IFRS 1.21451 28/04/2013 EUR 12 months IFRS 1.18742 29/04/2012 EUR 12 months IFRS 1.23059 01/05/2011 EUR 12 months IFRS 1.12079 Exchange rate: GBP EUR Assets Fixed asset Intangible fixed assets - Tangible fixed assets - Other fixed assets 300,787.425 55,671,554 183,693,124 61,422,748 185,218,002 59,729,036 85,940,225 39,348,740 268,500,635 65,676,414 147,942,373 54,881.848 251.844.158 63,701,061 143,623,396 44,319,701 230,174,003 66,002,011 122,263,919 41,908,073 211,273,705 71,662,500 99,447,193 40,164,012 179,383,526 56,717,743 85,380,243 37,285,340 165,289,353 49,278,076 75,638,878 40,372,399 175,358,900 50.084,963 78,511,564 46,762,373 125.753.08 32.951,343 43.262.648 49.539,094 158,745,952 Current assets - Stock - Dehors - Other current assets - Cash & cash equivalent 652,185,354 182.542.85 70,394,610 399,247 353,583,383 408, 129,084 221,287,381 109,599,882 77,241,822 41,636 357 429,623.743 184,416,644 104,195,972 141,011.125 86,129,277 402,690,165 186,130.239 77,080,652 139,479,275 77,435,862 377,300,816 144,307,310 52,160,813 180,832,694 129,056,359 366, 152,737 148,414.276 55,019,194 162.719.267 92,982,438 265,128,123 94,489,058 39,471,663 131,167,372 104,690,995 206,967,918 36,08R.203 33,604,085 87.275,628 64,714,381 68.297.677 28.918,826 61,529,439 38.025,193 134,719,437 58,617.525 24,881,626 51,220,285 36,089,566 TOTAL ASSETS 952,972,780 593347,086 698,124,377 654,534,324 607,474,820 577,426.442 444,511,650 372,257,271 334,104,852 260.472 521 Liabilities & Equity Shareholders funds - Capital - Other shareholders funds 129,631,904 4.715.979 302.356.500 4,755,127 297,601,373 464,166,354 4,658,708 459,507,646 440,934,483 4,854,542 436,079,941 429,846, 101 5,254,529 424,591,578 406,041,653 5,501.919 400,539,733 317,230,718 4,858,051 312,372,667 265,864,124 4,749,694 261,114,430 226,428,334 4.922,355 221,505,979 169,015,732 4,483,176 164,532,557 124,915,925 Non-current liabilities - Long term debe - Other non-current liabilities 293.770.969 276,977.484 16,793,485 14,032,912 120,269.923 0 120,269,923 72,370,716 65,790,041 0 65,790,041 7,014,875 57,188,871 0 57,188,871 4,854.542 44,471,258 0 44,471,258 4,998,211 43,740,259 0 43,740,259 5,226,823 38,500,053 0 38,500,053 3,279,184 38,235,037 237,485 37,997,352 3,443,528 42,209,195 492,236 41,716,959 3,814,825 43,598,086 1,008,715 42,590,171 3,922,779 Provisions Current liabilities - Loans - Creditors - Other current liabilities 529,569 907 403,503,743 37,857,008 68,209,156 170,720,663 0 74,458,333 96,262330 168,167,981 0 92,151,509 76,016,473 156,410,970 0 91,170,664 65.240.306 133,157,455 0 72,538,133 60,619,323 127,644,530 0 70,424,568 57,219,962 88,780,879 121,451 51,495,339 37,164,089 68,158, 110 237,485 38,472.322 29,448,103 65,467323 246,118 44.547,314 20.673,891 47,857,903 0 27,459,453 20,398.450 TOTAL SHAREL FUNDS & LIAR. 952,972,780 593,347,086 698,124.377 654,534,324 607,474,820 577,426.442 444,511,650 372,257,271 334,104,852 260,472,521 Memo lines Working capital Net current assets Enterprise value 195,080,487 122,615,448 428,112,419 256,428,930 237,408,422 479,4R6, 360 196,461,108 261,455,760 1,361,736,491 172,040,227 246,279,196 1,353,816,42 123.929.990 244,143,361 1,140,057,835 133,008,902 238,508.207 970,251,237 82,465,413 176,347,245 1,573,900,005 81.219.768 138,809,808 515,656,689 52,669,200 93.278,629 570,925,570 56,039,699 86,861.534 1,391, 192,509 Number of employees 3.216 3.279 3,286 3,143 2,787 2.352 2,228 2,022 1,774 1,277 Profit&loss account Consolidated 25/04/2020 EUR 12 months IFRS 1.15024 810,228,154 m.a. 27/04/2019 EUR 12 months IFRS 1.15979 1,023,512,125 na. 28.04.2018 EUR 12 months IFRS 1.13627 1,004,203.689 29/04/2017 EUR 12 months IFRS 1.18403 904,365,623 n. 30/04/2016 EUR 12 months IFRS 1.28159 776,645,023 25/04/2015 FUR 12 months IFRS 1.37548 677,561,376 na. 26/04/2014 EUR 12 months IFRS 1.21451 529,041,734 na. 28.04.2013 EUR 12 months IFRS 1.18742 434,122,036 11.a. 29.04.2012 EUR 12 months IFRS 1.23059 389,481.347 ma n. 01/05/2011 EUR 12 months IFRS 1.12079 267,421,444 11.2. Exchange rate: GBPEUR Operating revenue (Turnover) - Sales 11.a n. Costs of goods sold 375,552.942 449,301,527 415, 206,738 354,026, 344 297 585, 766 261,891,164 210,839,405 178,588,496 166,129,45 117,795,44 Gross profit 434,675,212 574,210,599 589,496,951 550,339.279 479,059.257 415,670,012 318,202,328 255,533.540 223,351,863 149,625,997 Other operating expenses 618,023,261 653,308,080 511,548,819 447,091,463 407,161.920 332,865,125 263,913,611 194.381,229 160,222,658 96,724,521 Operating P1. [-ERIT] -183,348,052 - 79,097,481 77,948, 132 103,247,817 71,897,336 82,803 87 54,288,7IR 61,152,311 6.3,129,204 52,901,476 607,256 123,059 -3,408,810 340,881 D.a. - Financial revenue - Financial expenses Financial PL PL before tax 230,048 8,856,838 -8,626,790 -191,974.842 -18,440,615 1,507,723 -19,946.338 -99,045,819 -2,841,683 n.a -2,841,683 100,406,134 -768.955 128.159 -897,113 71,000.222 -137,548 825,28% -962,836 81,841,051 356,227 n. a. 356,227 61,508,538 112,079 na. 112,079 53,013,555 -3.749,591 607,256 54,895,974 123,059 63,252.263 74,198,440 Taxation -27,030,610 15,193,211 16,589,544 22,259,850 18,070,454 18,568,978 21,132,521 18,405,064 18,828,008 19.277,656 P:L after tax - 164,944,232 - 114,239,030 57,608,896 78,146,283 32,929,768 63,272,073 33,763,453 43,103,473 44,424,253 33,735,899 n.a 11.a. n. a n. a 11a. n. a. .a. 11.2. Extr. and other revenue - Extr. and other expenses Extr. and other PL n.a. na. . n. na. 11.a. . n. na. 11.2. na. .. m.a. n.a m.al ma n.a. na. TI. m.a. n.al PiL for period (=Net income] ( -164,944,232 - 114,239,030 57,608,896 78.146.283 52,929,768 63,272,073 33,763,453 43,103,473 44 424 255 33,735,899 660,498,760 122,935,819 Memo lines Export revenue Material cases Costs of employees Depreciation & Amortization Research & Development expenses Other operating items Interest paid 517,607,424 n. 119,279,755 260,299,022 D.a D.a. 8,856,838 133,819.413 98,002,011 ma 624,721,325 Tl.a. 132.829,980 52,722,935 .. n.a. 340,881 512,450,172 na 126,099.68 43,217,263 n.a 364,741,210 na 107,397,447 40,754,640 277,296,738 na. 92,157,150 36,862,860 n.a. 213,875,687 na 78.214,618 27.083.613 147,715,485 Tl.a. 64,120,870 21,611,108 n. a. 61,406,380 16,243,772 65,454,369 na. 34,520,455 8,854,272 , La. na D.a n. a. ILA . na. D.a. .a 825.288 1,507,723 n. a 128,159 Ila. n.a. na. 1.a. 121,363,546 60.847,086 64.714 581 60,668,027 42.590,171 Cash flow kw Added value EBITDA 95,354,790 196,460,77 76,950,970 -16,237,020 134,303,347 18,904,530 110,131.631 260,092 216 130,671,067 m.al 93.684 408 219,280,468 112,651,976 100,134,933 211,686,349 119,666, 747 Ta, .. n.a ma 146,465,079 81,372,351 82,763,419 79,372,976 61,755,748 Consolidated 25.04.2020 EUR 27/04/2019 EUR 28/04/2018 EUR 29/04/2017 EUR 30/04/2016 EUR 26/04/2014 EUR 28/04/2013 EUS 29/04/2012 EUR 25/04/2015 EUR IFRS 199548 01/05/2011 Eur TERS 12079 IFRS Exchange rate:GBPEUR 1024 18970 1.13627 1BAS 128159 12145 1824 Profitability ratios an 23.14 41.9 ROE using L. Delore taxi ROP before taxi ROE using Net income (%) ROCE using Net income (% ROA using Net income (% 93 18.4 2015 127.24 -36.87 -17.31 15.99 10 124 16.21 10.60 123 11.15 14 15.58 14.25 10.96 na na na. 13.30 Se aus 15.35 EBITDA Margin() EBIT Margin(%) Cash flow / Operating revenue (%) Enterprise value / EBITDA (X 9.50 -22.63 NON ES 20 24. Operational ratios Net assets turnover (8) Interest cover (x) Stock turnover (x) Conectora period las) Fort revenue Operating revenue (%) R&D expenses / Operating revenue (%) Structure ratio Currem ratio (x) Shareholders liquidity ratio (x) Solvency ratio (Asset based) % Solvency ratio (Linbility based) (%) Gearing ma 9.1 Per employee ratios Profit per employee (th) Operating revenue per employee (th) Costs of employees / Operating revenue (%) Average cost of simplych Working capital per employee (th.) Total assets per employee (th Part 2 Look at the balance sheet and accounts data provided in the 'Materials', 'Part 2'. Analyse and discuss the financial performance of the company and its ability to create and capture value. 15961 - Catalog and mail-order houses - Key financials & employees Consolidated 25/04/2020 EUR 12 months IFRS 1.15024 27/04/2019 EUR 12 months IFRS 1.15979 28/04/2018 EUR 12 months IFRS 1.13627 29/04/2017 EUR 12 months IFRS 1.18403 30/04/2016 EUR 12 months IFRS 1.28159 25/04/2015 EUR 12 months IFRS 26/04/2014 EUR 12 months IFRS 1.21451 28/04/2013 EUR 12 months IFRS 1.18742 29/04/2012 EUR 12 months IFRS 1.23059 01/05/2011 EUR 12 months IFRS 1.12079 Exchange rate: GBP/EUR 1.37548 Operating revenue (Turnover) P/L before tax P/L for period (= Net Income] Cash flow Total assets Shareholders funds 810,228,154 1,023,512,125 1,004,803,689 -191,974,842 -99,045,819 74,198,440 -164,944,232 - 114,239,030 57,608,896 95,354,790 -16,237,020 110,331,831 952,972,780 593,347,086 698,124,377 129,631,904 302,356,500 464,166,354 904,365,623 100,406,134 78,146,283 121,363,546 654,534,324 440,934,483 776,645,023 71,000,222 52,929,768 93,684,408 607,474,820 429,846,107 677,561,376 81,841,051 63,272,073 100,134,933 577,426,442 406,041,653 529,041,734 54,895,974 33,763,453 60,847,086 444,511,650 317,230,718 434,122,036 61,508,538 43,103,473 64,714,581 372,257,271 265,864,124 389,481,347 63,252,263 44,424,255 60,668,027 334,104,852 226,428,334 267,421,444 53.013,555 33,735,899 42,590,171 260,472,521 169,015,732 Current ratio (x) Profit margin (%) ROE using P/L before tax (%) ROCE using P/L before tax (%) Solvency ratio (Asset based) (%) 1.23 -23.69 -148.09 -43.25 13.60 2.39 -9.68 -32.76 -23.08 50.96 2.56 7.38 15.99 14.07 66.49 2.58 11.10 22.77 n.a. 67.37 2.83 9.14 16.52 15.00 70.76 2.87 12.08 20.16 18.38 70.32 2.99 10.38 17.31 n.a. 71.37 3.04 14.17 23.14 n.a. 71.42 2.43 16.24 27.94 2.82 19.82 31.37 67.77 64.89 Number of employees 3,216 3,279 3,286 3,143 2,787 2,352 2,228 2,022 1,774 1,277 Evolution of a key variable: Operating revenue (Turnover) (2011 - 2020) 1,200,000,000 1,000,000,000 800,000,000 600,000,000 400,000,000 Consolidated 25/04/2020 EUR 12 months IFRS 1.15024 27/04/2019 EUR 12 months IFRS 1.15979 28/04/2018 EUR 12 months IFRS 1.13627 29.04.2017 EUR 12 months IFRS 1.18403 30/04/2016 EUR 12 months IFRS 1.28159 25/04/2015 EUR 12 months IFRS 1.37548 26.04.2014 ELR 12 months IFRS 1.21451 28/04/2013 EUR 12 months IFRS 1.18742 29/04/2012 EUR 12 months IFRS 1.23059 01/05/2011 EUR 12 months IFRS 1.12079 Exchange rate: GBP EUR Assets Fixed asset Intangible fixed assets - Tangible fixed assets - Other fixed assets 300,787.425 55,671,554 183,693,124 61,422,748 185,218,002 59,729,036 85,940,225 39,348,740 268,500,635 65,676,414 147,942,373 54,881.848 251.844.158 63,701,061 143,623,396 44,319,701 230,174,003 66,002,011 122,263,919 41,908,073 211,273,705 71,662,500 99,447,193 40,164,012 179,383,526 56,717,743 85,380,243 37,285,340 165,289,353 49,278,076 75,638,878 40,372,399 175,358,900 50.084,963 78,511,564 46,762,373 125.753.08 32.951,343 43.262.648 49.539,094 158,745,952 Current assets - Stock - Dehors - Other current assets - Cash & cash equivalent 652,185,354 182.542.85 70,394,610 399,247 353,583,383 408, 129,084 221,287,381 109,599,882 77,241,822 41,636 357 429,623.743 184,416,644 104,195,972 141,011.125 86,129,277 402,690,165 186,130.239 77,080,652 139,479,275 77,435,862 377,300,816 144,307,310 52,160,813 180,832,694 129,056,359 366, 152,737 148,414.276 55,019,194 162.719.267 92,982,438 265,128,123 94,489,058 39,471,663 131,167,372 104,690,995 206,967,918 36,08R.203 33,604,085 87.275,628 64,714,381 68.297.677 28.918,826 61,529,439 38.025,193 134,719,437 58,617.525 24,881,626 51,220,285 36,089,566 TOTAL ASSETS 952,972,780 593347,086 698,124,377 654,534,324 607,474,820 577,426.442 444,511,650 372,257,271 334,104,852 260.472 521 Liabilities & Equity Shareholders funds - Capital - Other shareholders funds 129,631,904 4.715.979 302.356.500 4,755,127 297,601,373 464,166,354 4,658,708 459,507,646 440,934,483 4,854,542 436,079,941 429,846, 101 5,254,529 424,591,578 406,041,653 5,501.919 400,539,733 317,230,718 4,858,051 312,372,667 265,864,124 4,749,694 261,114,430 226,428,334 4.922,355 221,505,979 169,015,732 4,483,176 164,532,557 124,915,925 Non-current liabilities - Long term debe - Other non-current liabilities 293.770.969 276,977.484 16,793,485 14,032,912 120,269.923 0 120,269,923 72,370,716 65,790,041 0 65,790,041 7,014,875 57,188,871 0 57,188,871 4,854.542 44,471,258 0 44,471,258 4,998,211 43,740,259 0 43,740,259 5,226,823 38,500,053 0 38,500,053 3,279,184 38,235,037 237,485 37,997,352 3,443,528 42,209,195 492,236 41,716,959 3,814,825 43,598,086 1,008,715 42,590,171 3,922,779 Provisions Current liabilities - Loans - Creditors - Other current liabilities 529,569 907 403,503,743 37,857,008 68,209,156 170,720,663 0 74,458,333 96,262330 168,167,981 0 92,151,509 76,016,473 156,410,970 0 91,170,664 65.240.306 133,157,455 0 72,538,133 60,619,323 127,644,530 0 70,424,568 57,219,962 88,780,879 121,451 51,495,339 37,164,089 68,158, 110 237,485 38,472.322 29,448,103 65,467323 246,118 44.547,314 20.673,891 47,857,903 0 27,459,453 20,398.450 TOTAL SHAREL FUNDS & LIAR. 952,972,780 593,347,086 698,124.377 654,534,324 607,474,820 577,426.442 444,511,650 372,257,271 334,104,852 260,472,521 Memo lines Working capital Net current assets Enterprise value 195,080,487 122,615,448 428,112,419 256,428,930 237,408,422 479,4R6, 360 196,461,108 261,455,760 1,361,736,491 172,040,227 246,279,196 1,353,816,42 123.929.990 244,143,361 1,140,057,835 133,008,902 238,508.207 970,251,237 82,465,413 176,347,245 1,573,900,005 81.219.768 138,809,808 515,656,689 52,669,200 93.278,629 570,925,570 56,039,699 86,861.534 1,391, 192,509 Number of employees 3.216 3.279 3,286 3,143 2,787 2.352 2,228 2,022 1,774 1,277 Profit&loss account Consolidated 25/04/2020 EUR 12 months IFRS 1.15024 810,228,154 m.a. 27/04/2019 EUR 12 months IFRS 1.15979 1,023,512,125 na. 28.04.2018 EUR 12 months IFRS 1.13627 1,004,203.689 29/04/2017 EUR 12 months IFRS 1.18403 904,365,623 n. 30/04/2016 EUR 12 months IFRS 1.28159 776,645,023 25/04/2015 FUR 12 months IFRS 1.37548 677,561,376 na. 26/04/2014 EUR 12 months IFRS 1.21451 529,041,734 na. 28.04.2013 EUR 12 months IFRS 1.18742 434,122,036 11.a. 29.04.2012 EUR 12 months IFRS 1.23059 389,481.347 ma n. 01/05/2011 EUR 12 months IFRS 1.12079 267,421,444 11.2. Exchange rate: GBPEUR Operating revenue (Turnover) - Sales 11.a n. Costs of goods sold 375,552.942 449,301,527 415, 206,738 354,026, 344 297 585, 766 261,891,164 210,839,405 178,588,496 166,129,45 117,795,44 Gross profit 434,675,212 574,210,599 589,496,951 550,339.279 479,059.257 415,670,012 318,202,328 255,533.540 223,351,863 149,625,997 Other operating expenses 618,023,261 653,308,080 511,548,819 447,091,463 407,161.920 332,865,125 263,913,611 194.381,229 160,222,658 96,724,521 Operating P1. [-ERIT] -183,348,052 - 79,097,481 77,948, 132 103,247,817 71,897,336 82,803 87 54,288,7IR 61,152,311 6.3,129,204 52,901,476 607,256 123,059 -3,408,810 340,881 D.a. - Financial revenue - Financial expenses Financial PL PL before tax 230,048 8,856,838 -8,626,790 -191,974.842 -18,440,615 1,507,723 -19,946.338 -99,045,819 -2,841,683 n.a -2,841,683 100,406,134 -768.955 128.159 -897,113 71,000.222 -137,548 825,28% -962,836 81,841,051 356,227 n. a. 356,227 61,508,538 112,079 na. 112,079 53,013,555 -3.749,591 607,256 54,895,974 123,059 63,252.263 74,198,440 Taxation -27,030,610 15,193,211 16,589,544 22,259,850 18,070,454 18,568,978 21,132,521 18,405,064 18,828,008 19.277,656 P:L after tax - 164,944,232 - 114,239,030 57,608,896 78,146,283 32,929,768 63,272,073 33,763,453 43,103,473 44,424,253 33,735,899 n.a 11.a. n. a n. a 11a. n. a. .a. 11.2. Extr. and other revenue - Extr. and other expenses Extr. and other PL n.a. na. . n. na. 11.a. . n. na. 11.2. na. .. m.a. n.a m.al ma n.a. na. TI. m.a. n.al PiL for period (=Net income] ( -164,944,232 - 114,239,030 57,608,896 78.146.283 52,929,768 63,272,073 33,763,453 43,103,473 44 424 255 33,735,899 660,498,760 122,935,819 Memo lines Export revenue Material cases Costs of employees Depreciation & Amortization Research & Development expenses Other operating items Interest paid 517,607,424 n. 119,279,755 260,299,022 D.a D.a. 8,856,838 133,819.413 98,002,011 ma 624,721,325 Tl.a. 132.829,980 52,722,935 .. n.a. 340,881 512,450,172 na 126,099.68 43,217,263 n.a 364,741,210 na 107,397,447 40,754,640 277,296,738 na. 92,157,150 36,862,860 n.a. 213,875,687 na 78.214,618 27.083.613 147,715,485 Tl.a. 64,120,870 21,611,108 n. a. 61,406,380 16,243,772 65,454,369 na. 34,520,455 8,854,272 , La. na D.a n. a. ILA . na. D.a. .a 825.288 1,507,723 n. a 128,159 Ila. n.a. na. 1.a. 121,363,546 60.847,086 64.714 581 60,668,027 42.590,171 Cash flow kw Added value EBITDA 95,354,790 196,460,77 76,950,970 -16,237,020 134,303,347 18,904,530 110,131.631 260,092 216 130,671,067 m.al 93.684 408 219,280,468 112,651,976 100,134,933 211,686,349 119,666, 747 Ta, .. n.a ma 146,465,079 81,372,351 82,763,419 79,372,976 61,755,748 Consolidated 25.04.2020 EUR 27/04/2019 EUR 28/04/2018 EUR 29/04/2017 EUR 30/04/2016 EUR 26/04/2014 EUR 28/04/2013 EUS 29/04/2012 EUR 25/04/2015 EUR IFRS 199548 01/05/2011 Eur TERS 12079 IFRS Exchange rate:GBPEUR 1024 18970 1.13627 1BAS 128159 12145 1824 Profitability ratios an 23.14 41.9 ROE using L. Delore taxi ROP before taxi ROE using Net income (%) ROCE using Net income (% ROA using Net income (% 93 18.4 2015 127.24 -36.87 -17.31 15.99 10 124 16.21 10.60 123 11.15 14 15.58 14.25 10.96 na na na. 13.30 Se aus 15.35 EBITDA Margin() EBIT Margin(%) Cash flow / Operating revenue (%) Enterprise value / EBITDA (X 9.50 -22.63 NON ES 20 24. Operational ratios Net assets turnover (8) Interest cover (x) Stock turnover (x) Conectora period las) Fort revenue Operating revenue (%) R&D expenses / Operating revenue (%) Structure ratio Currem ratio (x) Shareholders liquidity ratio (x) Solvency ratio (Asset based) % Solvency ratio (Linbility based) (%) Gearing ma 9.1 Per employee ratios Profit per employee (th) Operating revenue per employee (th) Costs of employees / Operating revenue (%) Average cost of simplych Working capital per employee (th.) Total assets per employee (th


