Question
PART 2. The researcher also wants to look at the role age plays in tasks completion. She summarizes the data as young (1) (less than
PART 2.
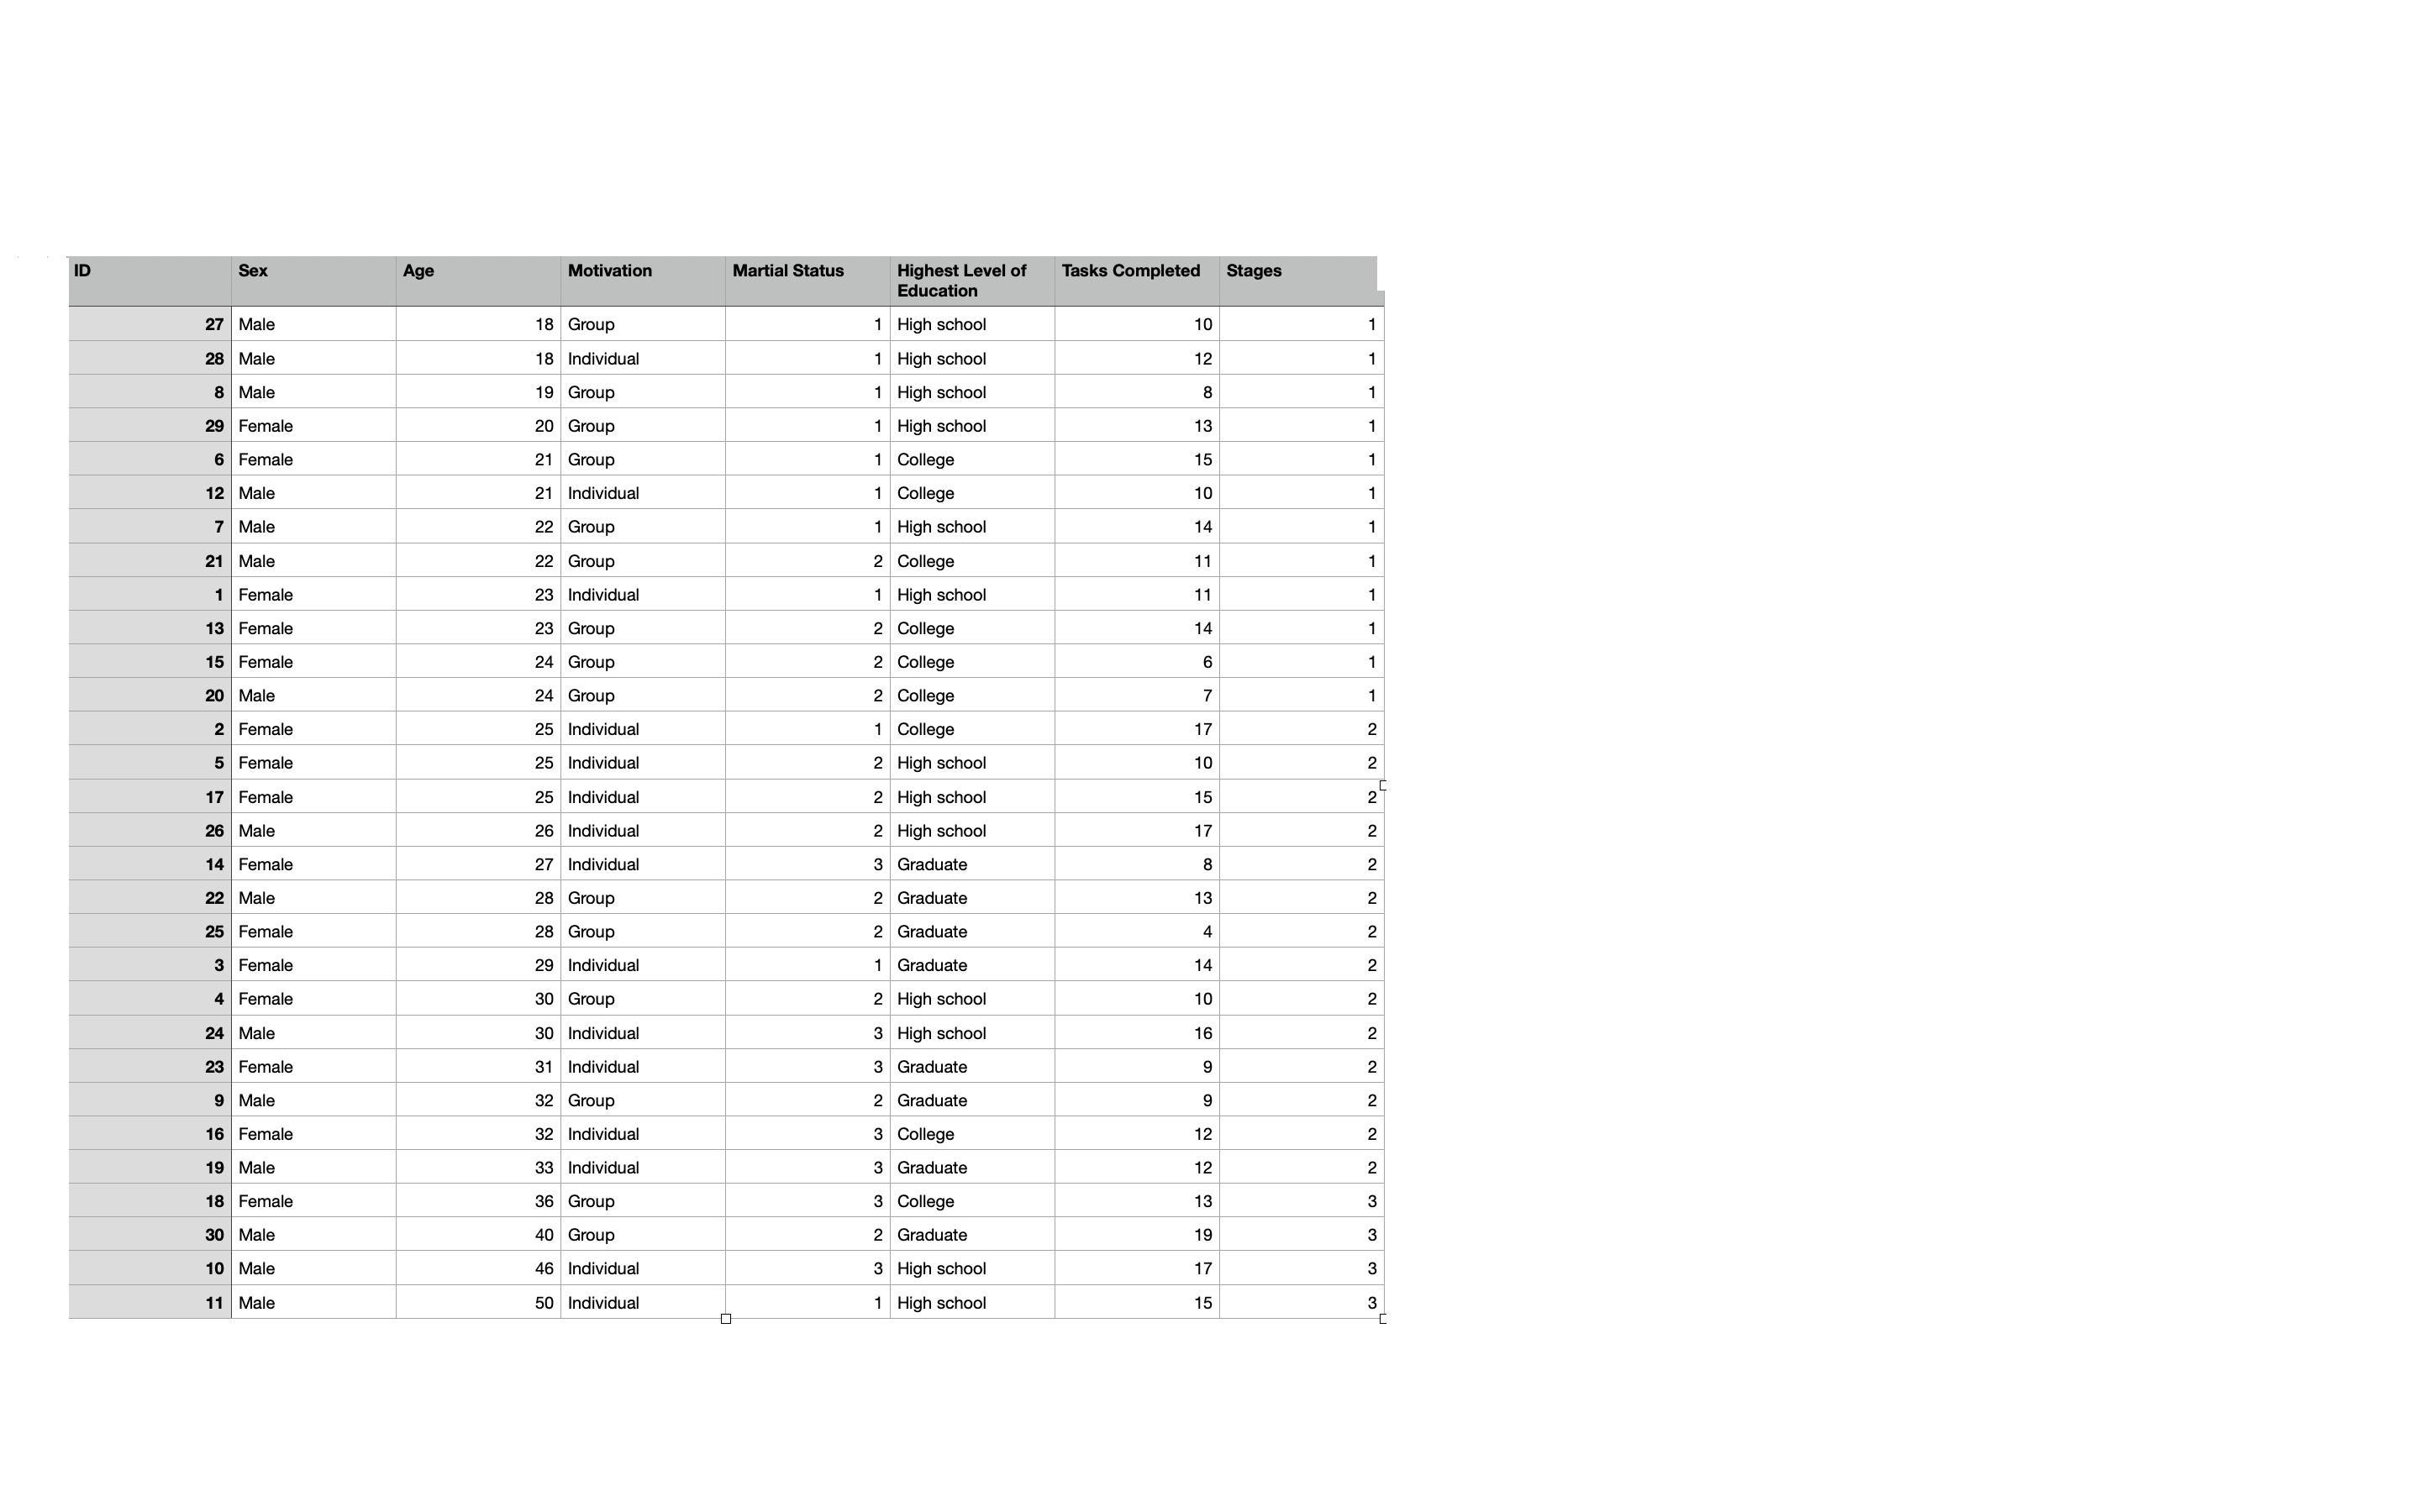
The researcher also wants to look at the role age plays in tasks completion. She summarizes the data as young (1) (less than 25), average (2) (25 - 35), old (3) (35+).
Go back to the original excel file and highlight (clicking the letter on top) and filter the data from lowest to highest by clicking the A-to-Z button and select "ascending". In the column to the right on the data you can code all data less than 25 as Stage 1, between 25 and 35 calories as Stage 2, and data more than 35 as Stage 3.
Bring the CSV file into JASP and rename the dummy code to 1 as Stage 1, 2 as Stage 2, and 3 as Stage 3 by clicking on the variable name at the top of the data. Click on each number and give appropriate name.
- Construct a histogram with normal curve on these data in JASP.
- Click on the Descriptives function and move the age data into the variable box and split it by your category variable. Select the frequency box to see the frequencies of each age given. Which group is most frequently represented?
- Create a box plot of the categorical data by going into plots choosing Boxplots and then Boxplot element. Looking at the boxplots, which data set is the most normally distributed and what aspects of the plot did you use to determine this?

Step by Step Solution
There are 3 Steps involved in it
Step: 1

Get Instant Access to Expert-Tailored Solutions
See step-by-step solutions with expert insights and AI powered tools for academic success
Step: 2

Step: 3

Ace Your Homework with AI
Get the answers you need in no time with our AI-driven, step-by-step assistance
Get Started


