

Question
Part 3: Prepare a one-page business report that includes a synopsis of the case and your credit decision for LAF. Include in your report your
Part 3: Prepare a one-page business report that includes a synopsis of the case and your credit decision for LAF. Include in your report your justification for the credit decision (hint: the importance of the cash budget when determining a credit decision and the financial position and performance from Pro forma financial statements).
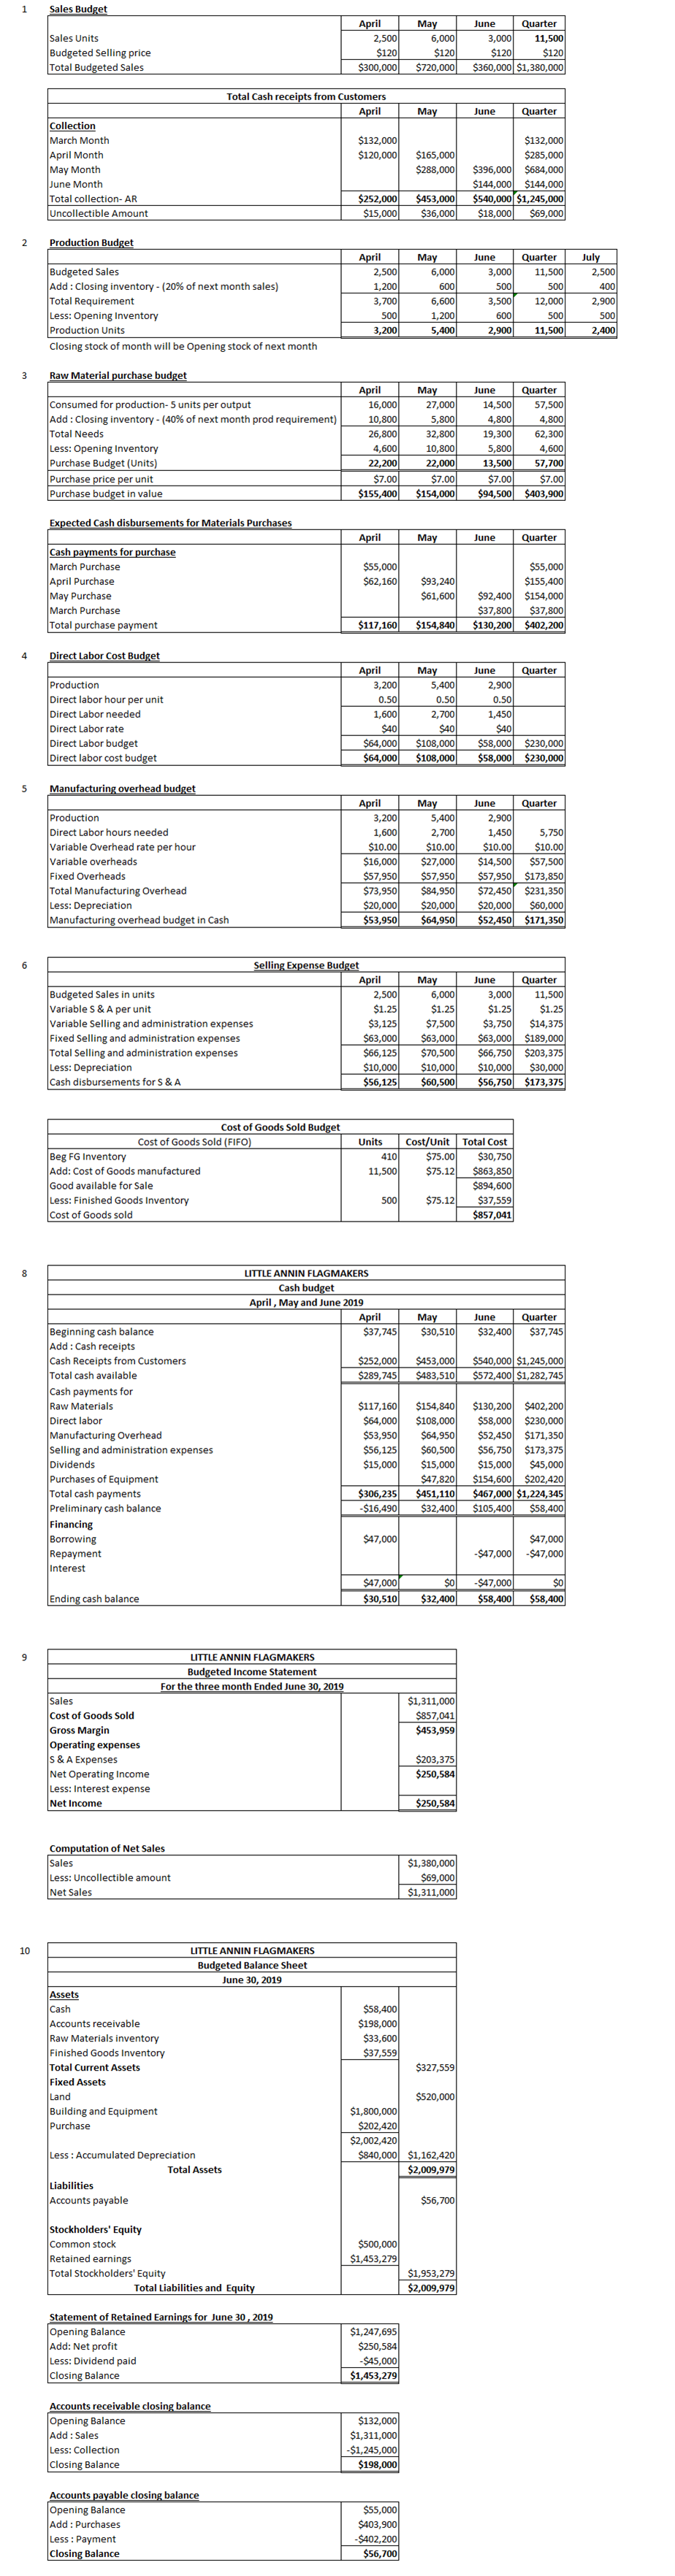
1 Sales Budget Sales Units Budgeted Selling price Total Budgeted Sales April 2,500 $120 $300,000 May 6,000 $120 $720,000 June Quarter 3,000 11,500 $120 $360,000 $1,380,000 $120 Total Cash receipts from Customers April May June Quarter $132,000 $120,000 Collection March Month April Month May Month June Month Total collection- AR Uncollectible Amount $165,000 $288,000 $132,000 $285,000 $396,000 $684,000 $144,000 $144,000 $540,000 $1,245,000 $18,000 $69,000 $252,000 $15,000 $453,000 $36,000 2 Production Budget May Budgeted Sales Add: Closing inventory - (20% of next month sales) Total Requirement Less: Opening Inventory Production Units Closing stock of month will be opening stock of next month April 2,500 1,200 3,700 500 3,200 6,000 600 6,600 1,200 5,400 June 3,000 500 3,500 600 2,9001 Quarter 11,500 500 12,000 500 11,500 July 2,500 400 2,900 500 2,400 3 Raw Material purchase budget Consumed for production-5 units per output Add: Closing inventory - (40% of next month prod requirement) Total Needs Less: Opening Inventory Purchase Budget (Units) Purchase price per unit Purchase budget in value April 16,000 10,800 26,800 4,600 22,200 $7.00 $155,400 May 27,000 5,800 32,800 10,800 22,000 $7.00 $154,000 June Quarter 14,500 57,500 4,800 4,800 19,300 62,300 5,800 4,600 13,500 57,700 $7.00 $7.00 $94,500 $403,900 Expected Cash disbursements for Materials Purchases April May June Quarter $55,000 $62,160 Cash payments for purchase March Purchase April Purchase May Purchase March Purchase Total purchase payment $93,240 $61,600 $92,400 $37,800 $130,200 $55,000 $155,400 $154,000 $37,800 $402,200 $117,160 $154,840 4 Direct Labor Cost Budget Production Direct labor hour per unit Direct Labor needed Direct Labor rate Direct Labor budget Direct labor cost budget April 3,200 0.50 1,600 $401 $64,000 $64,000 May 5,400 0.50 2,700 $401 $108,000 $108,000 June Quarter 2,900 0.500 1,450 $40 $58,000 $230,000 $58,000 $230,000 5 Manufacturing overhead budget Production Direct Labor hours needed Variable Overhead rate per hour Variable overheads Fixed Overheads Total Manufacturing Overhead Less: Depreciation Manufacturing overhead budget in Cash April 3,200 1,600 $10.00 $16,000 $57,950 $73,950 $20,000 $53,950 May 5,400 2,700 $10.00 $27,000 $57,950 $84,950 $20,000 $64,950 June Quarter 2,900 1,450 5,750 $10.00 $10.00 $14,5001 $57,500 $57,950 $173,850 $72,450 $231,350 $20,000 $60,000 $52,450 $171,350 6 Selling Expense Budget April Budgeted Sales in units 2,500 Variable S & A per unit $1.25 Variable Selling and administration expenses $3,125 Fixed Selling and administration expenses $63,000 Total Selling and administration expenses $66,125 Less: Depreciation $10,000 Cash disbursements for S & A $56,125 May 6,000 $1.25 $7,500 $63,000 $70,5001 $10,000 $60,500 June Quarter 3,000 11,500 $1.25 $1.25 $3,7501 $14,375 $63,000 $189,000 $66,750 $203,375 $10,000 $30,000 $56,750 $173,375 Cost of Goods Sold Budget Cost of Goods Sold (FIFO) Beg FG Inventory Add: Cost of Goods manufactured Good available for Sale Less: Finished Goods Inventory Cost of Goods sold Units 410 11,500 Cost/Unit Total Cost $75.00 $30,7501 $75.12 $863,850 $894,600 $75.12 $37,559 $857,041 500 8 LITTLE ANNIN FLAGMAKERS Cash budget April, May and June 2019 April $37,745 June May $30,510 Quarter $37,745 $32,400 $252,000 $289,745 $453,000 $483,510 $540,000 $1,245,000 $572,400 $1,282,745 Beginning cash balance Add : Cash receipts Cash Receipts from Customers Total cash available Cash payments for Raw Materials Direct labor Manufacturing Overhead Selling and administration expenses Dividends Purchases of Equipment Total cash payments Preliminary cash balance Financing Borrowing Repayment Interest $117,160 $64,000 $53,9501 $56,125 $15,000 $154,840 $108,000 $64,950 $60,500 $15,000 $47,820 $451,110 $32,400 $130,200 $402,200 $58,000 $230,000 $52,450 $171,350 $56,750 $173,375 $15,000 $45,000 $154,600 $202,420 $467,000 $1,224,345 $105,400 $58,400 $306,235 -$16,490 $47,000 $47,000 -$47,000 -$47,000 $47,000 $30,510 $0 $32,400 -$47,000 $58,400 $0 $58,400 Ending cash balance 9 LITTLE ANNIN FLAGMAKERS Budgeted Income Statement For the three month Ended June 30, 2019 $1,311,000 $857,041) $453,959 Sales Cost of Goods Sold Gross Margin Operating expenses S & A Expenses Net Operating Income Less: Interest expense Net Income $203,375 $250,584 $250,584 Computation of Net Sales Sales Less: Uncollectible amount Net Sales $1,380,000 $69,0001 $1,311,000 10 LITTLE ANNIN FLAGMAKERS Budgeted Balance Sheet June 30, 2019 Assets Cash Accounts receivable Raw Materials inventory Finished Goods Inventory Total Current Assets Fixed Assets Land Building and Equipment $58,400 $198,000 $33,600 $37,559 $327,5591 Purchase $520,000 $1,800,000 $202,420 $2,002,420 $840,000 $1,162,420 $2,009,979| Less : Accumulated Depreciation Total Assets Liabilities Accounts payable $56,700 stockholders' Equity Common stock Retained earnings Total Stockholders' Equity Total Liabilities and Equity $500,000 $1,453,279 $1,953,2791 $2,009,979 Statement of Retained Earnings for June 30, 2019 Opening Balance Add: Net profit Less: Dividend paid Closing Balance $1,247,695 $250,584 -$45,000 $1,453,279 Accounts receivable closing balance Opening Balance Add : Sales Less: Collection Closing Balance $132,000 $1,311,000 -$1,245,000 $198,000 Accounts payable closing balance Opening Balance Add: Purchases Less : Payment Closing Balance $55,000 $403,900 -$402, 2001 $56,700 1 Sales Budget Sales Units Budgeted Selling price Total Budgeted Sales April 2,500 $120 $300,000 May 6,000 $120 $720,000 June Quarter 3,000 11,500 $120 $360,000 $1,380,000 $120 Total Cash receipts from Customers April May June Quarter $132,000 $120,000 Collection March Month April Month May Month June Month Total collection- AR Uncollectible Amount $165,000 $288,000 $132,000 $285,000 $396,000 $684,000 $144,000 $144,000 $540,000 $1,245,000 $18,000 $69,000 $252,000 $15,000 $453,000 $36,000 2 Production Budget May Budgeted Sales Add: Closing inventory - (20% of next month sales) Total Requirement Less: Opening Inventory Production Units Closing stock of month will be opening stock of next month April 2,500 1,200 3,700 500 3,200 6,000 600 6,600 1,200 5,400 June 3,000 500 3,500 600 2,9001 Quarter 11,500 500 12,000 500 11,500 July 2,500 400 2,900 500 2,400 3 Raw Material purchase budget Consumed for production-5 units per output Add: Closing inventory - (40% of next month prod requirement) Total Needs Less: Opening Inventory Purchase Budget (Units) Purchase price per unit Purchase budget in value April 16,000 10,800 26,800 4,600 22,200 $7.00 $155,400 May 27,000 5,800 32,800 10,800 22,000 $7.00 $154,000 June Quarter 14,500 57,500 4,800 4,800 19,300 62,300 5,800 4,600 13,500 57,700 $7.00 $7.00 $94,500 $403,900 Expected Cash disbursements for Materials Purchases April May June Quarter $55,000 $62,160 Cash payments for purchase March Purchase April Purchase May Purchase March Purchase Total purchase payment $93,240 $61,600 $92,400 $37,800 $130,200 $55,000 $155,400 $154,000 $37,800 $402,200 $117,160 $154,840 4 Direct Labor Cost Budget Production Direct labor hour per unit Direct Labor needed Direct Labor rate Direct Labor budget Direct labor cost budget April 3,200 0.50 1,600 $401 $64,000 $64,000 May 5,400 0.50 2,700 $401 $108,000 $108,000 June Quarter 2,900 0.500 1,450 $40 $58,000 $230,000 $58,000 $230,000 5 Manufacturing overhead budget Production Direct Labor hours needed Variable Overhead rate per hour Variable overheads Fixed Overheads Total Manufacturing Overhead Less: Depreciation Manufacturing overhead budget in Cash April 3,200 1,600 $10.00 $16,000 $57,950 $73,950 $20,000 $53,950 May 5,400 2,700 $10.00 $27,000 $57,950 $84,950 $20,000 $64,950 June Quarter 2,900 1,450 5,750 $10.00 $10.00 $14,5001 $57,500 $57,950 $173,850 $72,450 $231,350 $20,000 $60,000 $52,450 $171,350 6 Selling Expense Budget April Budgeted Sales in units 2,500 Variable S & A per unit $1.25 Variable Selling and administration expenses $3,125 Fixed Selling and administration expenses $63,000 Total Selling and administration expenses $66,125 Less: Depreciation $10,000 Cash disbursements for S & A $56,125 May 6,000 $1.25 $7,500 $63,000 $70,5001 $10,000 $60,500 June Quarter 3,000 11,500 $1.25 $1.25 $3,7501 $14,375 $63,000 $189,000 $66,750 $203,375 $10,000 $30,000 $56,750 $173,375 Cost of Goods Sold Budget Cost of Goods Sold (FIFO) Beg FG Inventory Add: Cost of Goods manufactured Good available for Sale Less: Finished Goods Inventory Cost of Goods sold Units 410 11,500 Cost/Unit Total Cost $75.00 $30,7501 $75.12 $863,850 $894,600 $75.12 $37,559 $857,041 500 8 LITTLE ANNIN FLAGMAKERS Cash budget April, May and June 2019 April $37,745 June May $30,510 Quarter $37,745 $32,400 $252,000 $289,745 $453,000 $483,510 $540,000 $1,245,000 $572,400 $1,282,745 Beginning cash balance Add : Cash receipts Cash Receipts from Customers Total cash available Cash payments for Raw Materials Direct labor Manufacturing Overhead Selling and administration expenses Dividends Purchases of Equipment Total cash payments Preliminary cash balance Financing Borrowing Repayment Interest $117,160 $64,000 $53,9501 $56,125 $15,000 $154,840 $108,000 $64,950 $60,500 $15,000 $47,820 $451,110 $32,400 $130,200 $402,200 $58,000 $230,000 $52,450 $171,350 $56,750 $173,375 $15,000 $45,000 $154,600 $202,420 $467,000 $1,224,345 $105,400 $58,400 $306,235 -$16,490 $47,000 $47,000 -$47,000 -$47,000 $47,000 $30,510 $0 $32,400 -$47,000 $58,400 $0 $58,400 Ending cash balance 9 LITTLE ANNIN FLAGMAKERS Budgeted Income Statement For the three month Ended June 30, 2019 $1,311,000 $857,041) $453,959 Sales Cost of Goods Sold Gross Margin Operating expenses S & A Expenses Net Operating Income Less: Interest expense Net Income $203,375 $250,584 $250,584 Computation of Net Sales Sales Less: Uncollectible amount Net Sales $1,380,000 $69,0001 $1,311,000 10 LITTLE ANNIN FLAGMAKERS Budgeted Balance Sheet June 30, 2019 Assets Cash Accounts receivable Raw Materials inventory Finished Goods Inventory Total Current Assets Fixed Assets Land Building and Equipment $58,400 $198,000 $33,600 $37,559 $327,5591 Purchase $520,000 $1,800,000 $202,420 $2,002,420 $840,000 $1,162,420 $2,009,979| Less : Accumulated Depreciation Total Assets Liabilities Accounts payable $56,700 stockholders' Equity Common stock Retained earnings Total Stockholders' Equity Total Liabilities and Equity $500,000 $1,453,279 $1,953,2791 $2,009,979 Statement of Retained Earnings for June 30, 2019 Opening Balance Add: Net profit Less: Dividend paid Closing Balance $1,247,695 $250,584 -$45,000 $1,453,279 Accounts receivable closing balance Opening Balance Add : Sales Less: Collection Closing Balance $132,000 $1,311,000 -$1,245,000 $198,000 Accounts payable closing balance Opening Balance Add: Purchases Less : Payment Closing Balance $55,000 $403,900 -$402, 2001 $56,700Step by Step Solution
There are 3 Steps involved in it
Step: 1

Get Instant Access to Expert-Tailored Solutions
See step-by-step solutions with expert insights and AI powered tools for academic success
Step: 2

Step: 3
Ace Your Homework with AI
Get the answers you need in no time with our AI-driven, step-by-step assistance
Get Started
A Guide To Risk Based Internal Audit System In Banks
Authors: CA Shiva Chaudhari
1st Edition
1947498649, 978-1947498648