Answered step by step
Verified Expert Solution
Link Copied!

Question

1 Approved Answer

Part 4: Cross Country Models as of 2016 (-4 slides) Create a dataset that has one row for each country, corresponding to the 2016 values
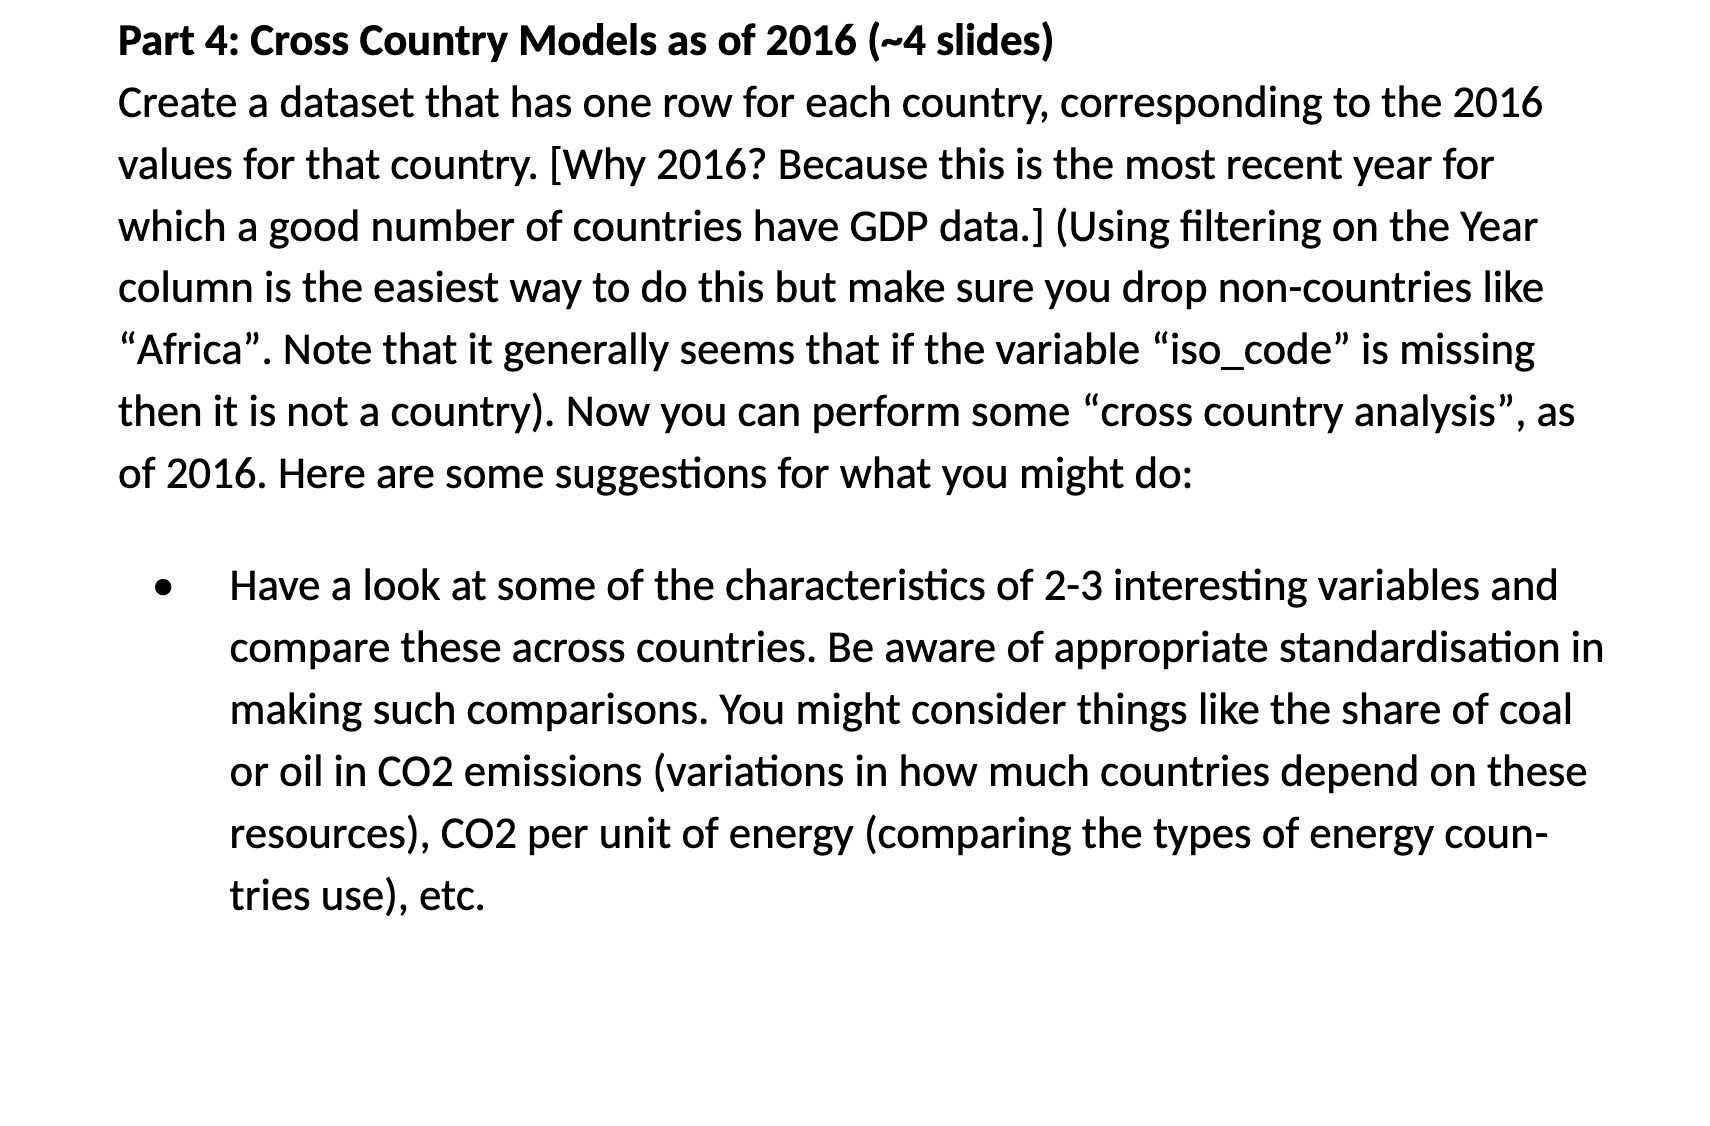
image text in transcribed
Part 4: Cross Country Models as of 2016 (-4 slides) Create a dataset that has one row for each country, corresponding to the 2016 values for that country. [Why 2016? Because this is the most recent year for which a good number of countries have GDP data.] (Using ltering on the Year column is the easiest way to do this but make sure you drop non-countries like \"Africa". Note that it generally seems that if the variable \"iso_code\" is missing then it is not a country). Now you can perform some \"cross country analysis", as of 2016. Here are some suggestions for what you might do: 0 Have a look at some of the characteristics of 2-3 interesting variables and compare these across countries. Be aware of appropriate standardisation in making such comparisons. You might consider things like the share of coal or oil in C02 emissions (variations in how much countries depend on these resources), C02 per unit of energy (comparing the types of energy coun- tries use), etc

Step by Step Solution

There are 3 Steps involved in it

Step: 1

blur-text-image

Get Instant Access to Expert-Tailored Solutions

See step-by-step solutions with expert insights and AI powered tools for academic success

Step: 2

blur-text-image

Step: 3

blur-text-image

Ace Your Homework with AI

Get the answers you need in no time with our AI-driven, step-by-step assistance

Get Started

Recommended Textbook for

An Introduction to the Mathematics of financial Derivatives

Authors: Salih N. Neftci

2nd Edition

978-0125153928, 9780080478647, 125153929, 978-0123846822

More Books

Students also viewed these Mathematics questions

Question

=+ c. How would the change you describe in part

Answered: 1 week ago