Answered step by step
Verified Expert Solution
Question
1 Approved Answer
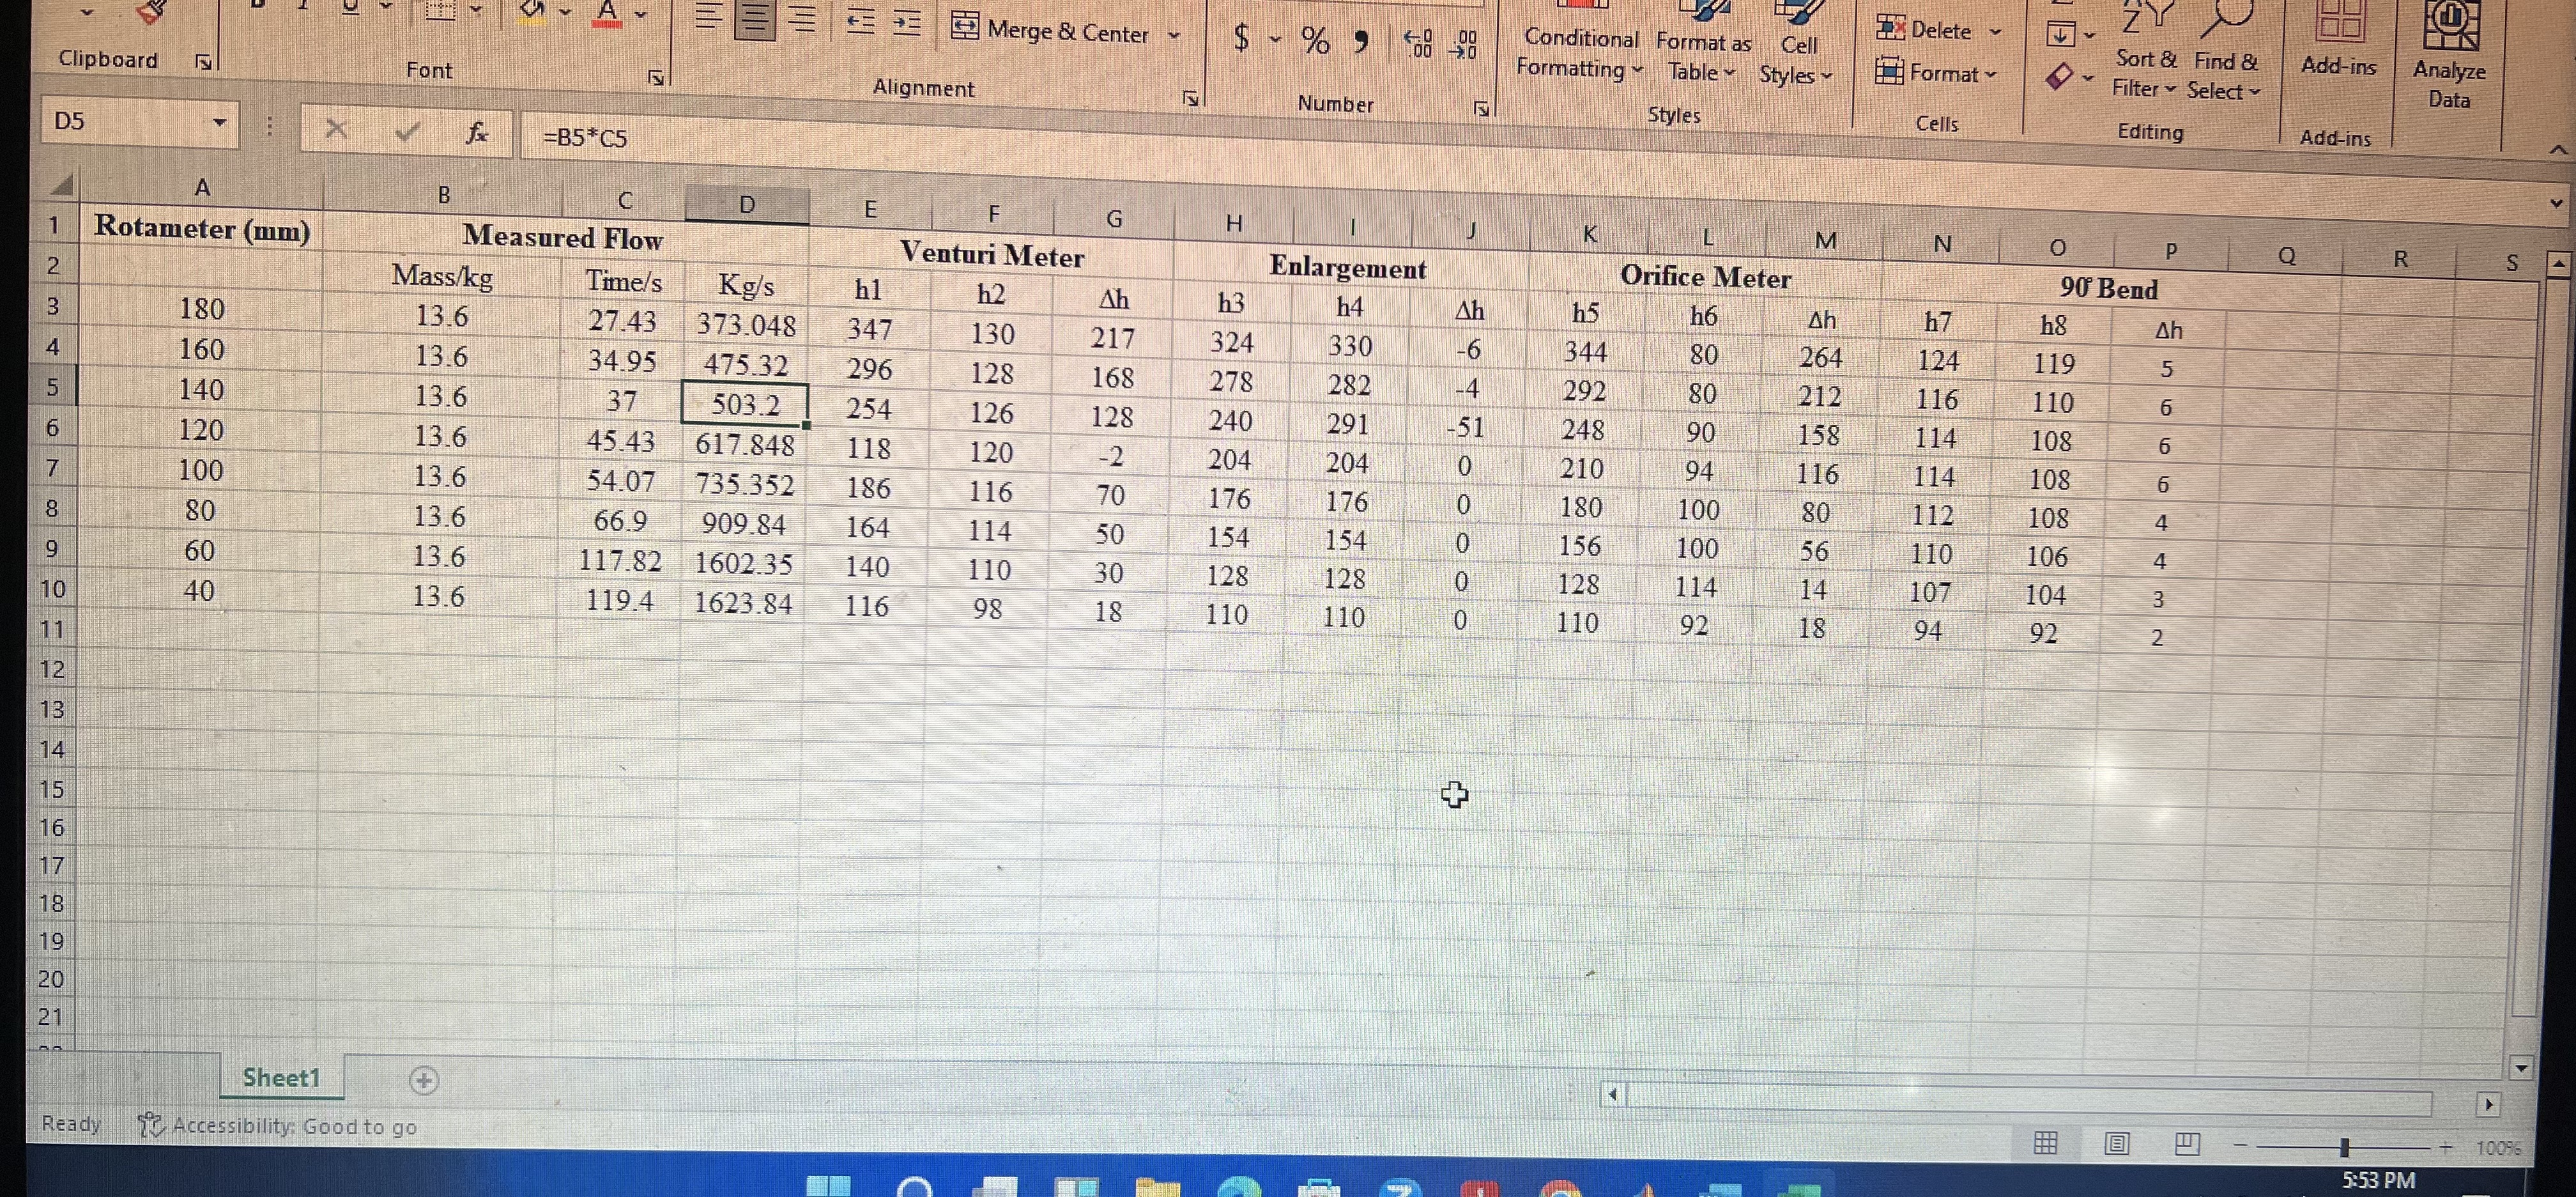
Part A 1. Plot graphs of discharge Q (10- m/s) vs. Ah (mm HO)1/2 for the Venturi and Orifice meters. 2. Hence, determine the


Part A 1. Plot graphs of discharge Q (10- m/s) vs. Ah (mm HO)1/2 for the Venturi and Orifice meters. 2. Hence, determine the value of Ca in each device. 3. Have the experimental results confirmed the theoretically derived equations? 4. Are the values of Ca obtained in the range expected? 5. Why is there such a difference between the two values of Ca? 6. Plot a graph of discharge Q (l/min or 1/s) vs. Rotameter reading (mm) to establish a calibration graph. 7. Comment on the nature of this calibration graph. ma T D5 1 Rotameter (mm) 2 4 5 LO 6 T 1-1 Clipboard 8 9 10 L N M 7 15 16 19 20 21 66 A Ready 5 180 160 140 120 100 80 60 40 Sheet1 Font B Accessibility: Good to go fx =B5*C5 Mass/kg 13.6 13.6 13.6 13.6 13.6 13.6 13.6 13.6 = Measured Flow Time/s 27.43 34.95 Kg/s 373.048 475.32 503.2 617.848 37 45.43 54.07 735.352 66.9 909.84 117.82 1602.35 119.4 1623.84 += + Merge & Center Alignment E hl 347 296 254 118 186 164 140 116 F Venturi Meter h2 130 128 126 120 116 114 110 98 G Ah 217 168 128 70 50 30 18 M 171 $ % 950 000 Conditional Format as Formatting H h3 324 278 240 204 176 154 128 110 Number Enlargement h4 330 282 291 204 176 154 128 110 Ah -6 -4 -51 0 0 0 0 0 h5 344 292 248 210 180 156 128 110 Table Styles Styles Orifice Meter h6 80 80 90 94 100 100 114 92 M Ah 264 212 158 116 80 56 18 Delete Format - Cells N h7 124 116 114 114 112 110 107 94 ZY Sort & Find & Filter Select Editing 90 Bend h8 119 110 108 108 108 106 104 92 V Ah 5 6 6 6 P NWA 4 3 2 Add-ins Add-ins R 0 Analyze Data 5:53 PM LO S 10086 >
Step by Step Solution
There are 3 Steps involved in it
Step: 1

Get Instant Access to Expert-Tailored Solutions
See step-by-step solutions with expert insights and AI powered tools for academic success
Step: 2

Step: 3

Ace Your Homework with AI
Get the answers you need in no time with our AI-driven, step-by-step assistance
Get Started


