Question
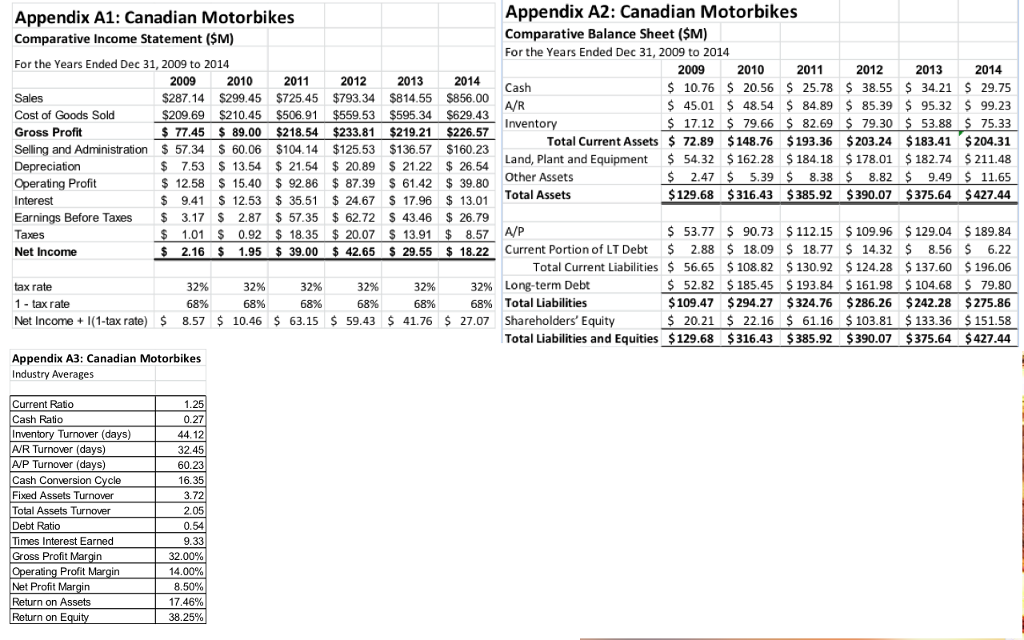
Part A (25 marks) Please find attached a multi-year Income Statement (Appendix A1) and multi-year Balance Sheet (Appendix A2) for Canadian Motorbikes. This company is

Part A (25 marks)
Please find attached a multi-year Income Statement (Appendix A1) and multi-year Balance Sheet (Appendix A2) for Canadian Motorbikes. This company is a (fictional) motorcycle manufacturer that brought on a new CEO in 2012. You work for an investment company that is considering investing in the motorcycle company and, if the investment is made, whether or not to retain the CEO. You are part of a team that is evaluating the performance of the company. Your job is to calculate and interpret important financial ratios and to make comments to help make a decision on whether or not to invest. Appendix A3 contains financial ratio averages for all companies in the industry. This should be useful.
Please use the information in Appendix A1 to A3 to do the following:
Calculate the Current Ratio, Debt Ratio, Return on Assets (ROA) and Return on Equity (ROE). For the ROA and ROE, you should use the average total assets and the average total equity in your calculations. (The average is the total across two years divided by two). Calculate these values for each of 2011-2014. Interpret your calculations: what does this information mean? How is the company doing? (16 marks)
Calculate ratios related to how quickly the company pays its trade debt and how quickly it collects from its customers. These are known as Accounts Payable (AP) Turnover and Accounts Receivable (AR) Turnover. The formula for AP Turnover is: Cost of Goods Sold/average accounts payable. The formula for AR Turnover is: credit sales/average accounts receivable. Calculate the AP and AR Turnover for each of 2011-2014. Interpret your calculations: what does this information mean? How is the company doing? (9 marks)
Appendix A1: Canadian Motorbikes Comparative Income Statement ($M) Appendix A2: Canadian Motorbikes Comparative Balance Sheet (SM) For the Years Ended Dec 31, 2009 to 2014 For the Years Ended Dec 31, 2009 to 2014 2009 2010 2011 2012 2013 2014 2009 2010 2011 287.14$299.45 $725.45 $793.34 $81455 $856.00 2012 2013 2014 $ 10.76 $ 20.56$ 25.78 $ 38.55 $ 34.21 S 29.75 $ 85.39 95.32 99.23 Sales Cost of Goods Sold$209.69 $210.45 $506.91 $559.53 $595.34 $629.43 Gross Profit Selling and Administration $ 57.34 $ 60.06 $104.14 $125.53 $136.57 $160.23 Depreciation Operating Profit Interest Earnings Before Taxes 3.17 S 2.87 57.35 62.72 S 43.46 26.79 Taxes Net Income A/R Inventory 45.01 48.54 $84.89 17.12 79.66 82.69$79.30 53.88 $ 75.33 Total Current Assets 72.89 $148.76 $193.36 $203.24 $183.41 $204.31 Land, Plant and Equipment $ 54.32 $162.28 $184.18 $178.01 $ 182.74 $ 211.48 9.49 11.65 129.68 $316.43 S385.92 $390.07 $375.64 $427.44 77.45 $ 89.00 $218.54 $233.81 $219.21 $226.57 $ 7.53$ 13.54 $21.54 $ 20.89 $ 21.22 $ 26.54 $12.58$ 15.40 $ 92.86 87.39 S 61.42 39.80 $9.41$ 12.53 35.51 24.67 $ 17.96 $ 13.01 Other Assets Total Assets 2.47 5.39 8.38 8.82 $ 1.01 S 0.92 $ 18.35 53.77 $90.73 $112.15 $109.96 $129.04 $189.84 2.16 $ 1.95 $ 39.00 $ 42.65 S 29.55 $ 18.22 Current Portion of LT Debt $ 2.88 $ 18.09 $ 18.77$ 14.32 $ 8.56 6.22 Total Current Liabilities $ 56.65 $108.82 $130.92 $124.28 $137.60 $196.06 $52.82 $185.45 $193.84 $ 161.98 104.68 79.80 109.47 $294.27 $324.76 $286.26 $242.28 $275.86 S20.21 22.16 61.16 $103.81 $ 133.36 $151.58 Total Liabilities and Equities $129.68 $316.43 $385.92 S390.07 S$375.64 $427.44 20.07 s 13.91 $ 8.57 A/P tax rate 1 -tax rate Net Income+(1-tax rate) 8.57 10.46 32% 68% 32% 68% Long-term Debt Total Liabilities 32% 68% 32% 68% 63.15 3296 68% 68% 59.43 41.76 27.07 Shareholders' Equity Appendix A3:Canadian Motorbikes Industry Averages Current Ratio Cash Ratio Inventory Turnover (days) AR Turnover (days) 1.25 0.27 44.12 32.45 60.23 16.35 3.72 2.05 0.54 9.33 32.00% 14.00% 8.50% 17 .46% 38.25% A/P Turnover (days) Cash Conversion Cycle Fixed Assets Turnover Total Assets Turnover Debt Ratio Times Interest Earned Gross Profit Margin ating Profit in Net Profit Return on Assets Return on EStep by Step Solution
There are 3 Steps involved in it
Step: 1

Get Instant Access to Expert-Tailored Solutions
See step-by-step solutions with expert insights and AI powered tools for academic success
Step: 2

Step: 3

Ace Your Homework with AI
Get the answers you need in no time with our AI-driven, step-by-step assistance
Get Started


