Answered step by step
Verified Expert Solution
Question
1 Approved Answer
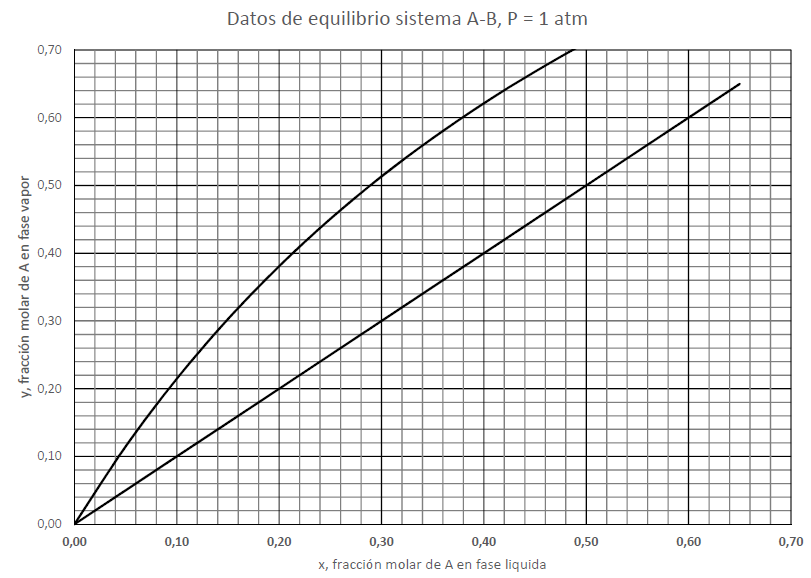
Part A. Graphical analysis and reasoning of the McCabe-Thiele design method. Specified data: Y D = 0,54 ; x F = 0,40 ; x B
Part A. Graphical analysis and reasoning of the McCabe-Thiele design method.
Specified data:
YD = 0,54 ; xF = 0,40 ; xB = 0,03 ; qF = 1,0
Find:
a. The lower minimum reflux ratio (V'/B)min
b. The actual number of stages if EMV = 0.50
c. The equation of the depletion zone operating line
d. The maximum composition of the top product
e. The ratio of (V'/B)/(V'/B)min

Step by Step Solution
There are 3 Steps involved in it
Step: 1

Get Instant Access to Expert-Tailored Solutions
See step-by-step solutions with expert insights and AI powered tools for academic success
Step: 2

Step: 3

Ace Your Homework with AI
Get the answers you need in no time with our AI-driven, step-by-step assistance
Get Started


