Part c 12. When prices are (P1, P2)= (1,2), the consumer demands (X1, X2) = (1,2). When prices are (Q1, Q2) = (2,1), the consumer
Part c
12. When prices are (P1, P2)= (1,2), the consumer demands (X1, X2) = (1,2). When prices are (Q1, Q2) = (2,1), the consumer demands (Y1, Y2) = (2,1). Is this consumer behaviour consistent with Weak Axiom of revealed preference ?
13. Prove that elasticity of demand is not constant along a linear demand curve.
14. Prove that expenditure share weighted sum of income elasticities equal 1.
15. Prove that both goods cannot be superior or inferior at the same time.
16. Relate elasticity of demand with different slopes of the demand curve.
17. The equation to the Engel's curve of a commodity is X = 50+2M2. Calculate the income elasticity of demand at M=$100. What can you infer about the nature of the commodity.
18. Calculate the own price elasticity of demand for the demand curve P= 15-3X at prices and compare the outcomes.
a) P=0
b) P=1/8
c) P=3
d) P=15
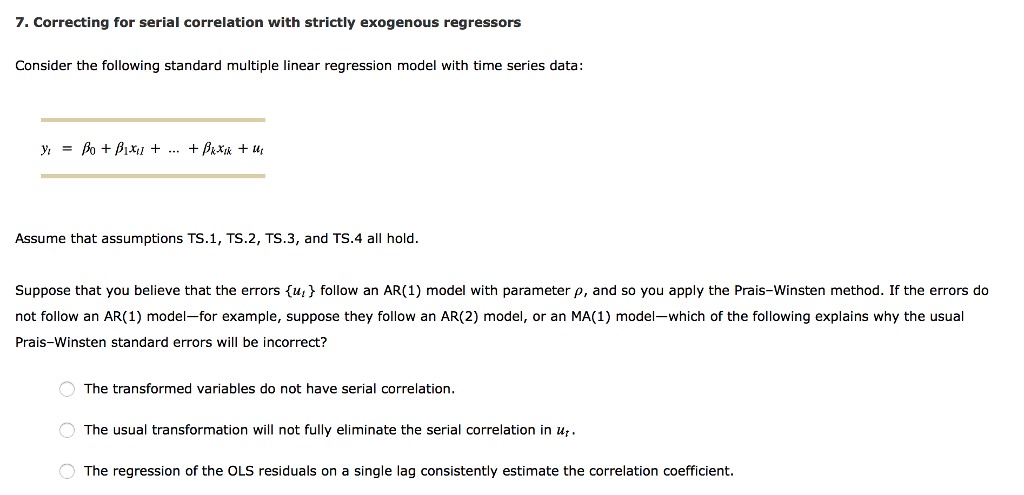
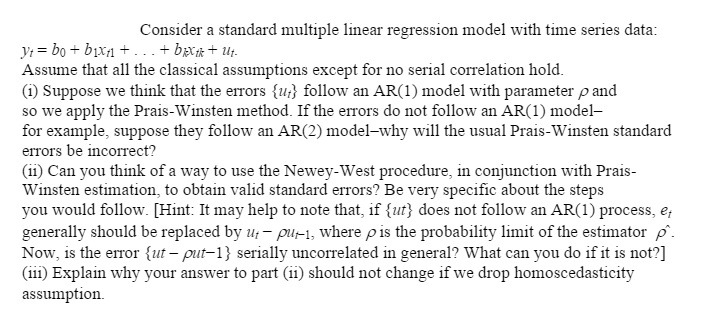
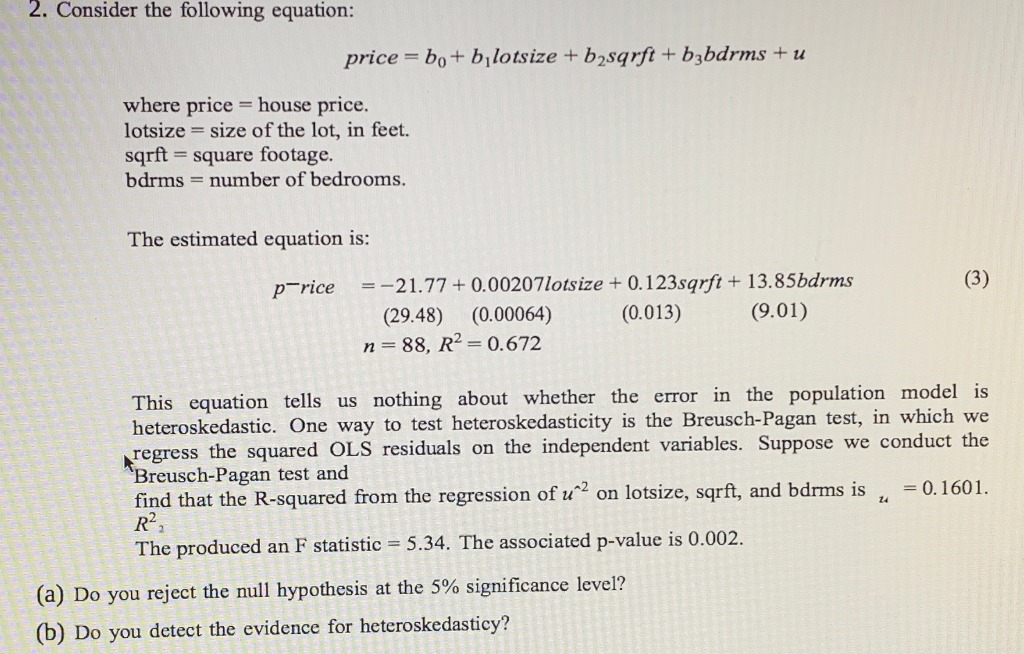
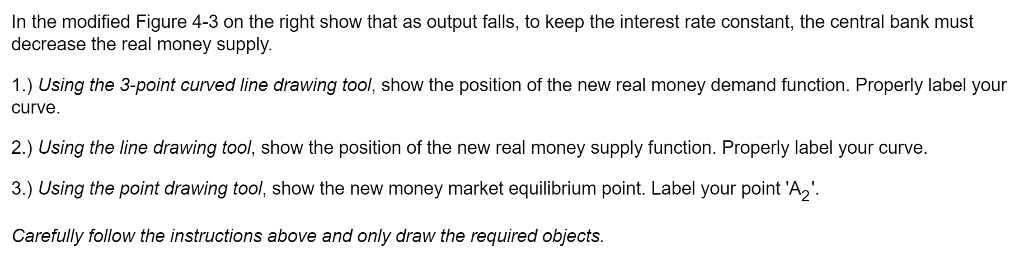
7. Correcting for serial correlation with strictly exogenous regressors Consider the following standard multiple linear regression model with time series data: y, = e +31%; + +tx\"; +3; Assume that assumptions 15.1,1'52, T53, and EA all hold. Suppose that you believe that the errors {to} follow an AMI} model with parameter p, and so you apply the PraisWinsten method. If the errors do not follow an AR(1) modelforexampie, suppose they follow an AR(2) model, or an MA(1) modelwhich of the following explains why the usual PraisWinsoen standard errors will be incorrect? "_-\" The tlansforrned variables do not have serial correlation. The usual transformation will not fully eliminate the serial correlation in up The regression of the OLS residuals on a single lag consistently estimate the correlation ooeicient. Consider a standard multiple linear regression model with time series data: VI = bo + bixn + ... + box+ Uit. Assume that all the classical assumptions except for no serial correlation hold. (i) Suppose we think that the errors {u} follow an AR(1) model with parameter p and so we apply the Prais-Winsten method. If the errors do not follow an AR(1) model- for example, suppose they follow an AR(2) model-why will the usual Prais-Winsten standard errors be incorrect? (ii) Can you think of a way to use the Newey-West procedure, in conjunction with Prais- Winsten estimation, to obtain valid standard errors? Be very specific about the steps you would follow. [Hint: It may help to note that, if {ut) does not follow an AR(1) process, et generally should be replaced by u - pur-1, where p is the probability limit of the estimator p. Now, is the error {ut - put-1} serially uncorrelated in general? What can you do if it is not?] (iii) Explain why your answer to part (ii) should not change if we drop homoscedasticity assumption.2. Consider the following equation: price = bo+ bylotsize + bysqrft + babdrms + u where price = house price. lotsize = size of the lot, in feet. sqrft = square footage. bdrms = number of bedrooms. The estimated equation is: p rice =-21.77 + 0.00207lotsize + 0.123sqrft + 13.85bdrms (3) (29.48) (0.00064) (0.013) (9.01) n = 88, R2 = 0.672 This equation tells us nothing about whether the error in the population model is heteroskedastic. One way to test heteroskedasticity is the Breusch-Pagan test, in which we regress the squared OLS residuals on the independent variables. Suppose we conduct the `Breusch-Pagan test and find that the R-squared from the regression of u" on lotsize, sqrft, and bdrms is , = 0.1601. R2 The produced an F statistic = 5.34. The associated p-value is 0.002. (a) Do you reject the null hypothesis at the 5% significance level? (b) Do you detect the evidence for heteroskedasticy?In the modified Figure 4-3 on the right show that as output falls, to keep the interest rate constant, the central bank must decrease the real money supply. 1.) Using the 3-point curved line drawing tool, show the position of the new real money demand function. Properly label your curve. 2.) Using the line drawing tool, show the position of the new real money supply function. Properly label your curve. 3.) Using the point drawing tool, show the new money market equilibrium point. Label your point 'A2'. Carefully follow the instructions above and only draw the required objects