

Answered step by step
Verified Expert Solution
Question
1 Approved Answer
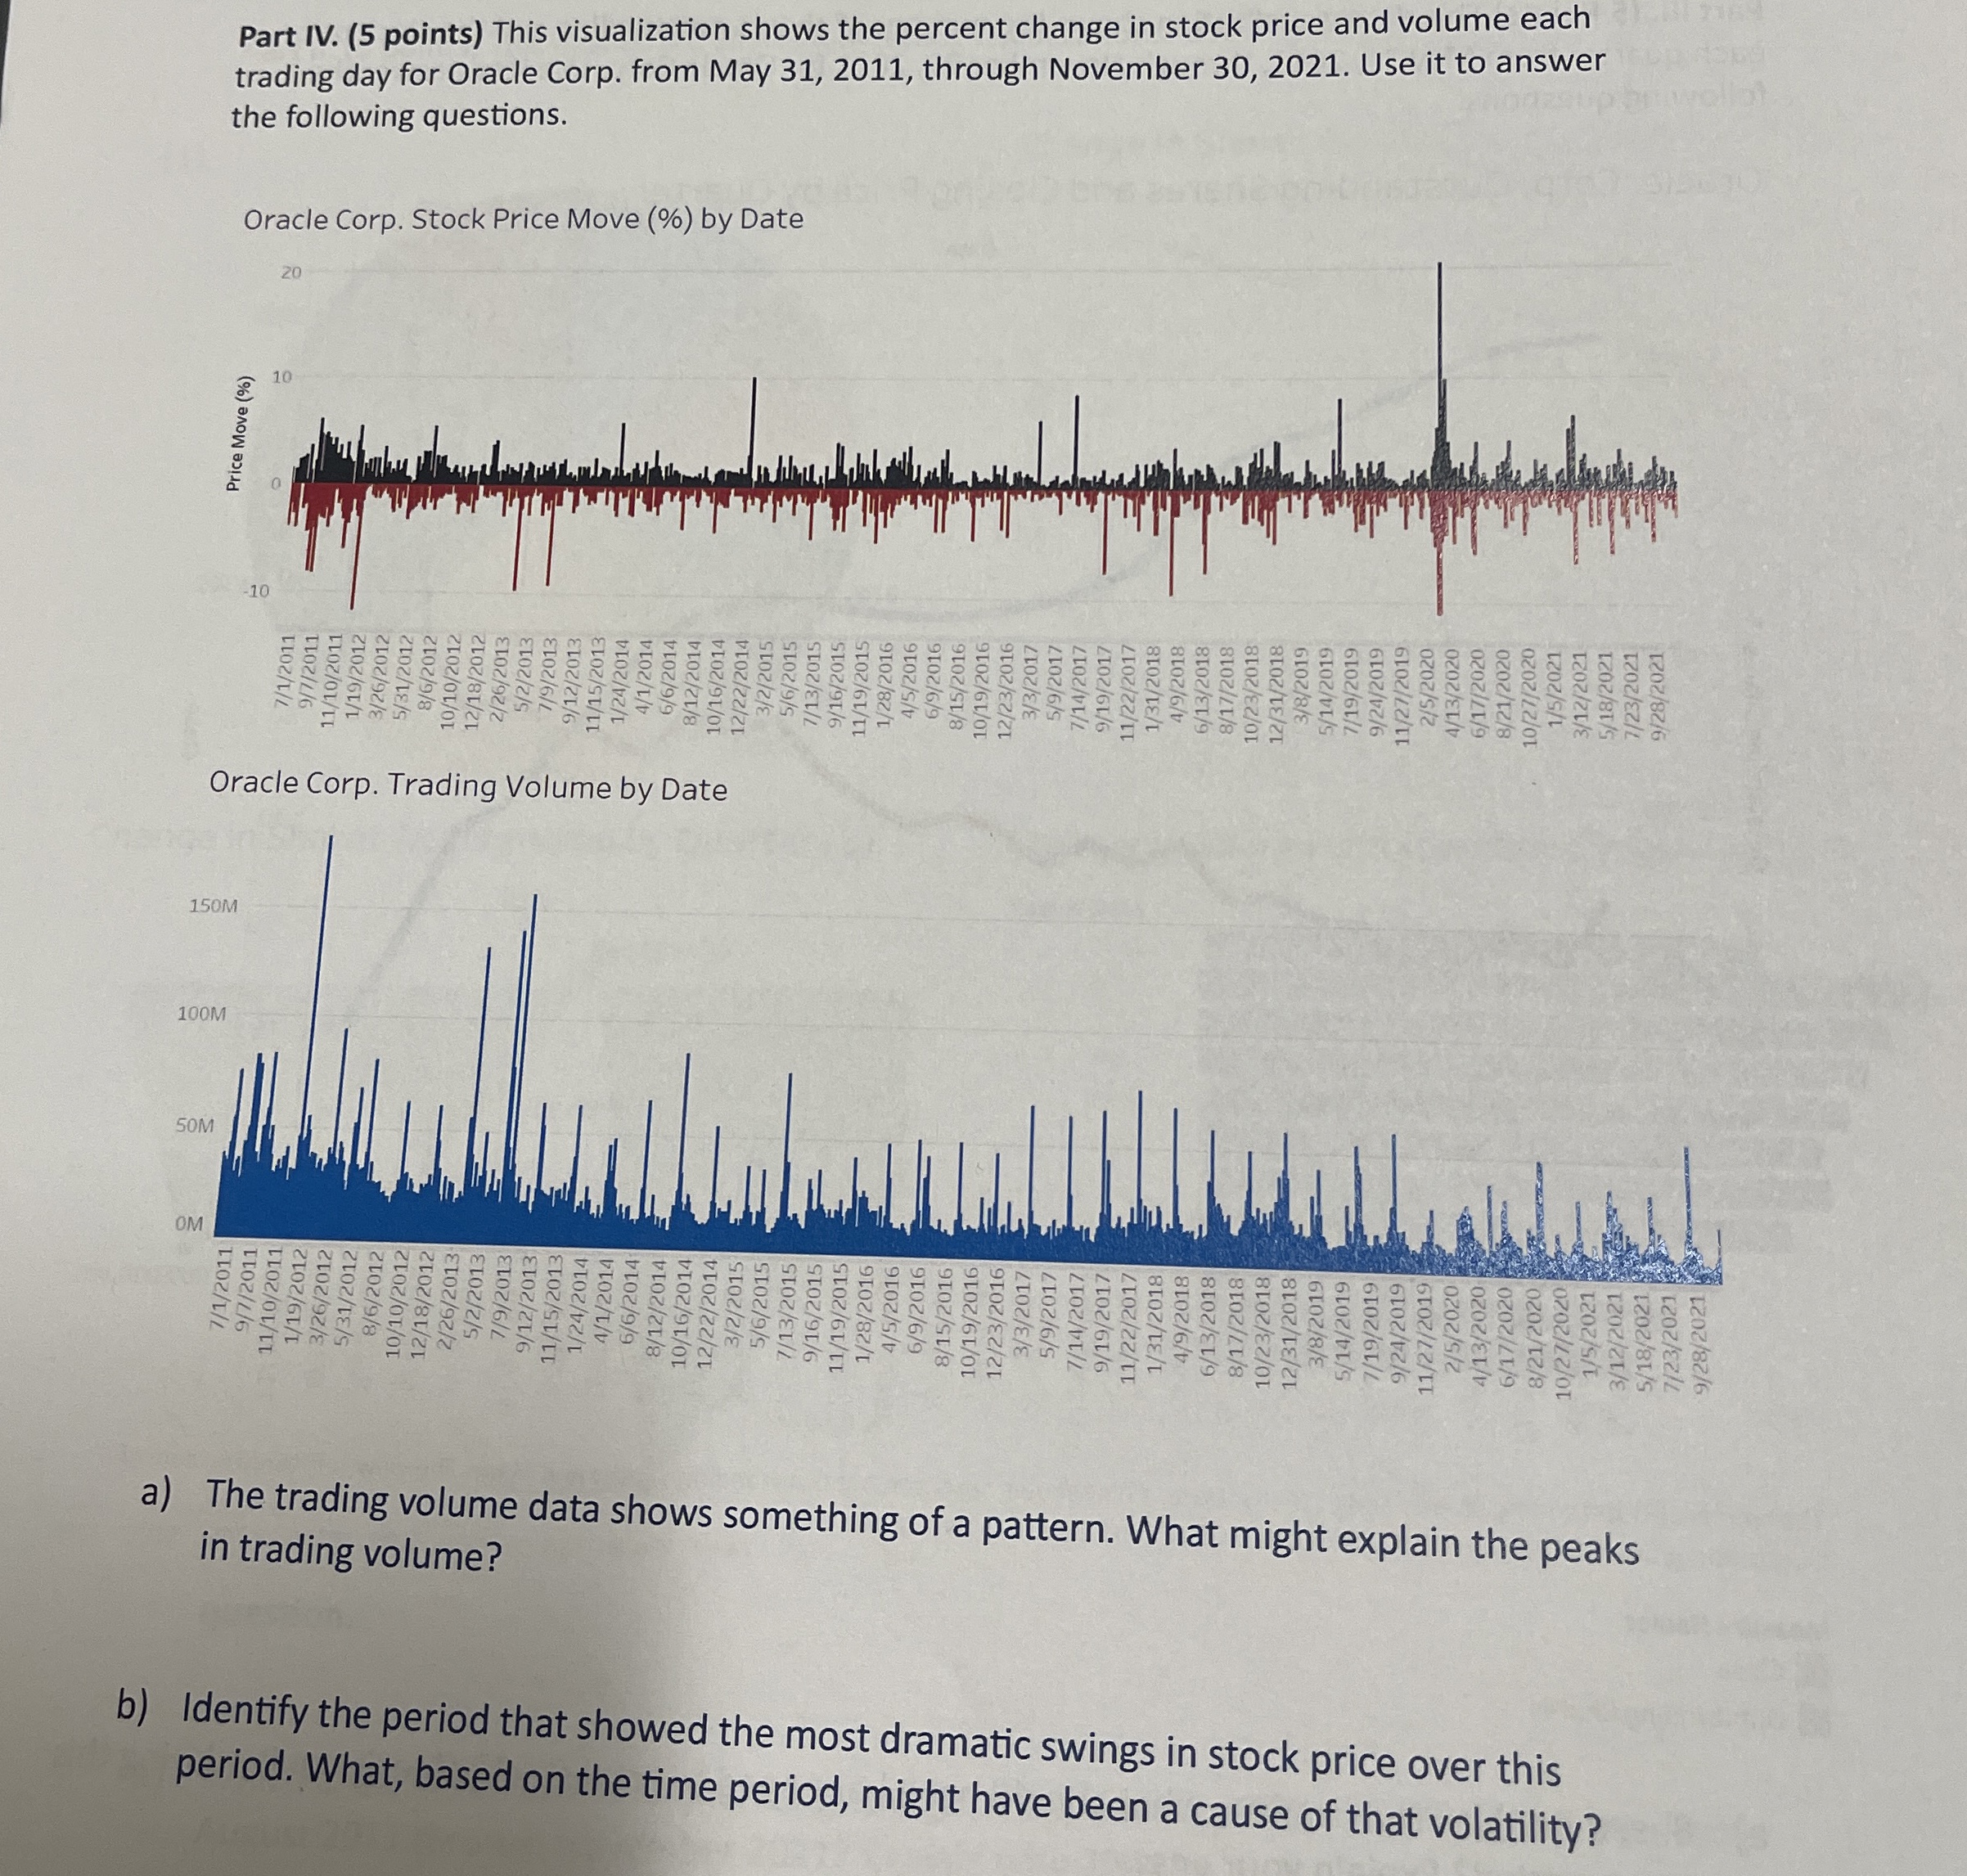
Part IV . ( 5 points ) This visualization shows the percent change in stock price and volume each trading day for Oracle Corp. from
Part IV points This visualization shows the percent change in stock price and volume each
trading day for Oracle Corp. from May through November Use it to answer
the following questions.
Oracle Corp. Stock Price Move by Date
Oracle Corp. Trading Volume by Date
a The trading volume data shows something of a pattern. What might explain the peaks
in trading volume?
b Identify the period that showed the most dramatic swings in stock price over this
period. What, based on the time period, might have been a cause of that volatility?
Step by Step Solution
There are 3 Steps involved in it
Step: 1

Get Instant Access to Expert-Tailored Solutions
See step-by-step solutions with expert insights and AI powered tools for academic success
Step: 2

Step: 3
Ace Your Homework with AI
Get the answers you need in no time with our AI-driven, step-by-step assistance
Get Started
Employment, Hours, And Earnings 2010 States And Areas
Authors: Sarah E. Baltic
5th Edition
1598884190, 9781598884197