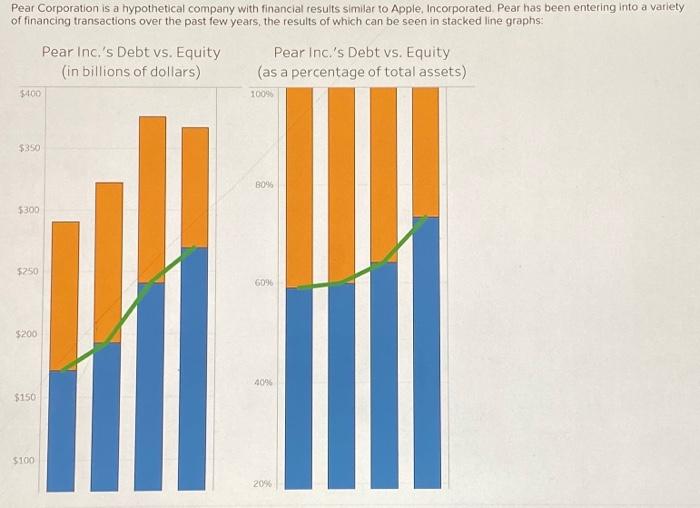
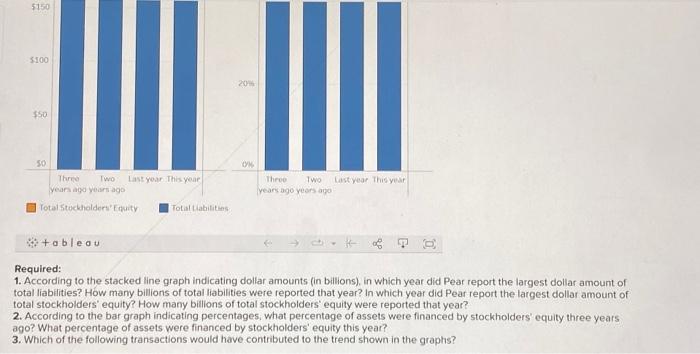
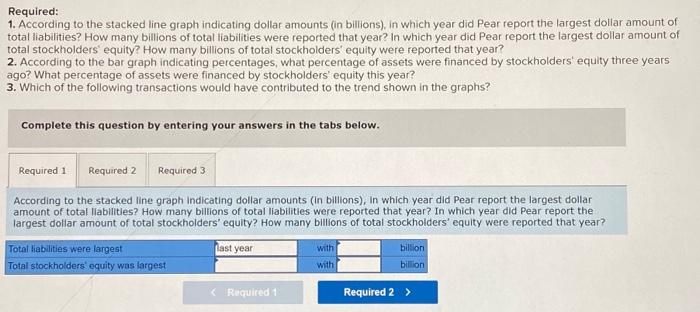
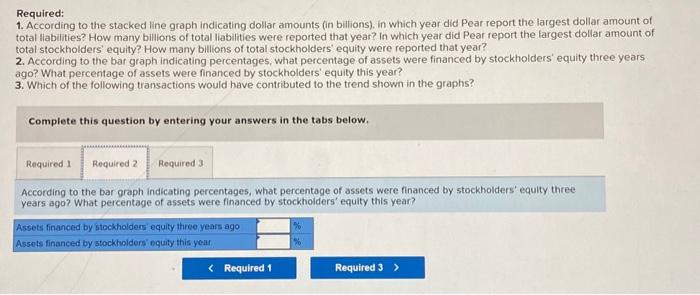
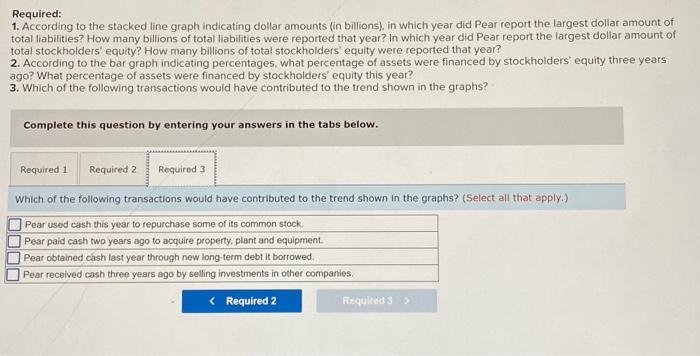
Pear Corporation is a hypothetical company with financial results similar to Apple, Incorporated. Pear has been entering into a variety of financing transactions over the past few years, the results of which can be seen in stacked line graphs: Pear Inc,'s Debt vs. Equity Pear Inc.'s Debt vs. Equity Required: 1. According to the stacked line graph indicating dollar amounts (in billions), in which year did Pear report the largest dollar amount of total liabilities? How many billions of total liabilities were reported that year? In which year did Pear report the largest dollar amount of total stockholders' equity? How many billions of total stockholders' equity were reported that year? 2. According to the bar graph indicating percentages, what percentage of assets were financed by stockholders' equity three years ago? What percentage of assets were financed by stockholders' equity this year? 3. Which of the following transactions would have contributed to the trend shown in the graphs? Complete this question by entering your answers in the tabs below. Which of the following transactions would have contributed to the trend shown in the graphs? (Select all that apply.) Required: 1. According to the stacked line graph indicating dollar amounts (in billions), in which year did Pear report the largest dollar amount of total liabilities? How many billions of total liabilities were reported that year? In which year did Pear report the largest dollar amount of total stockholders' equity? How many billions of total stockholders' equity were reported that year? 2. According to the bar graph indicating percentages, what percentage of assets were financed by stockholders' equity three years ago? What percentage of assets were financed by stockholders' equity this year? 3. Which of the following transactions would have contributed to the trend shown in the graphs? Complete this question by entering your answers in the tabs below. According to the stacked line graph indicating dollar amounts (In billions), In which year did Pear report the largest dollar amount of total llabilities? How many billions of total liabilities were reported that year? In which year did Pear report the largest dollar amount of total stockholders' equity? How many billions of total stockhoiders' equity were reported that year? Required: 1. According to the stacked line graph indicating dollar amounts (in billions), in which year did Pear report the largest dollar amount of total liabilities? How many billions of total liabilities were reported that year? In which year did Pear report the largest dollar amount of total stockholders' equity? How many billions of total stockholders' equity were reported that year? 2. According to the bar graph indicating percentages, what percentage of assets were financed by stockholders' equity three years ago? What percentage of assets were financed by stockholders' equity this year? 3. Which of the following transactions would have contributed to the trend shown in the graphs? Complete this question by entering your answers in the tabs below. According to the bar graph indicating percentages, what percentage of assets were financed by stockholders' equity three years ago? What percentage of assets were financed by stockholders' equity this year? Required: 1. According to the stacked line graph indicating dollar amounts (in billions), in which year did Pear report the largest dollar amount of total liabilities? How many billions of total liabilities were reported that year? in which year did Pear report the largest dollar amount of total stockholders' equity? How many billions of total stockholders' equity were reported that year? 2. According to the bar graph indicating percentages; what percentage of assets were financed by stockholders' equity three years ago? What percentage of assets were financed by stockholders' equity this year? 3. Which of the following transactions would have contributed to the trend shown in the graphs