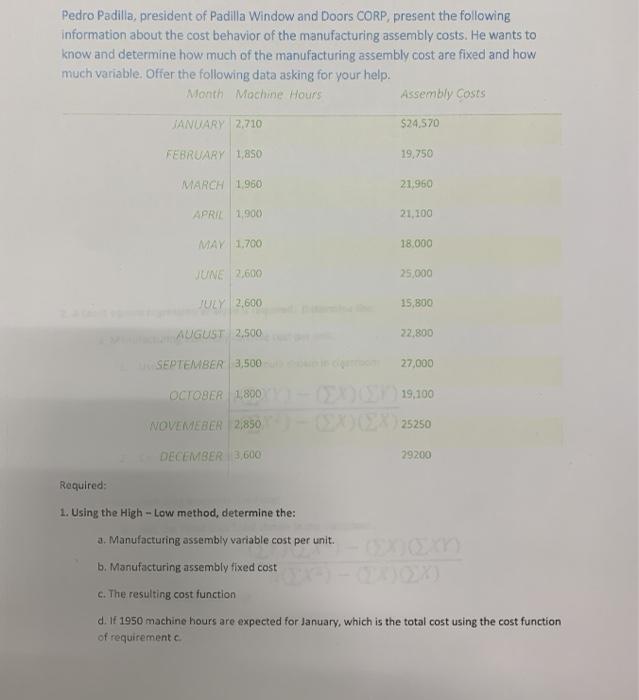
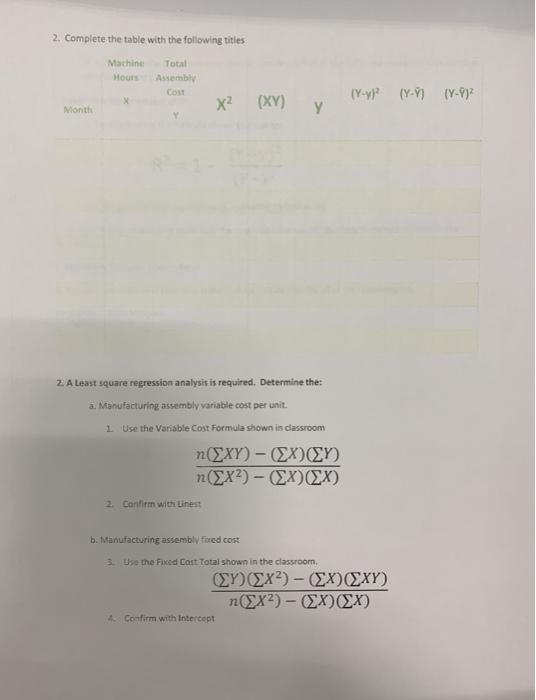
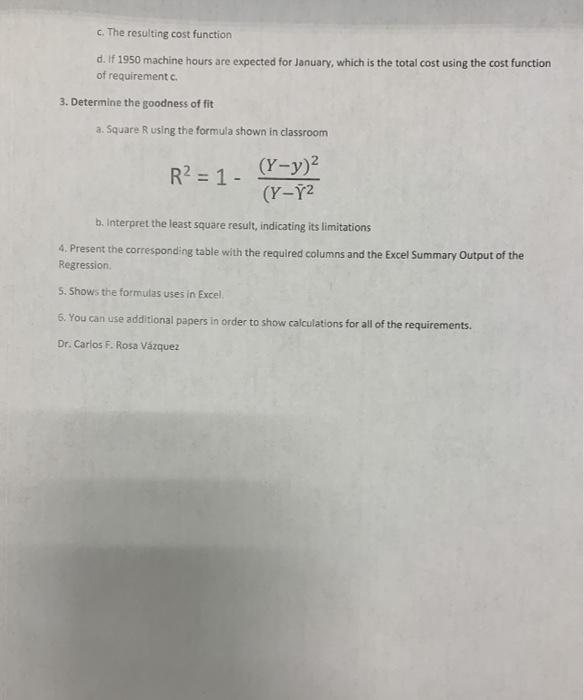
Pedro Padilla, president of Padilla Window and Doors CORP, present the following information about the cost behavior of the manufacturing assembly costs. He wants to know and determine how much of the manufacturing assembly cost are fixed and how much variable. Offer the following data asking for your help. Month Mochine Hours Assembly Costs JANUARY 2710 $24.570 FEBRUARY 1,850 19,750 MARCH 1960 21,950 APRIL 1.900 21,100 MAY 1.700 18.000 JUNE 2.600 25,000 JULY 2,600 15,800 AUGUST 2.500 22.800 SEPTEMBER 3,500 27,000 OCTOBER 1,800 19,100 25250 WOVEMEBER 2850 DECEMBER 3,600 29200 Required: 1. Using the High-Low method, determine the: a. Manufacturing assembly variable cost per unit. b. Manufacturing assembly fixed cost c. The resulting cost function d. 1950 machine hours are expected for January, which is the total cost using the cost function of requiremente 2. Complete the table with the following titles Machine Total Hours Assembly X2 Month (M-y? (Y-Y) (Y-??? (XY) 2. A least square regression analysis is required. Determine the: 3. Manufacturing assembly variabile cost per unit. 1 Use the Variable Cost Formula shown is dassroom () - () ) (?) - ()(). 2. Confirm with Lines b. Manufacturing assembly fixed cost 3. Use the Fixed Cost Total shown in the classroom, ) x?)- ()() n(x2) - (X)(EX) Confirm with Intercept c. The resulting cost function d. If 1950 machine hours are expected for January, which is the total cost using the cost function of requirements 3. Determine the goodness of fit a. Square R using the formula shown in classroom R2 = 1 - (Y-y)2 (Y-Y2 b. Interpret the least square result, indicating its limitations 4. Present the corresponding table with the required columns and the Excel Summary Output of the Regression S. Shows the formulas uses in Excel 6. You can use additional papers in order to show calculations for all of the requirements. Dr. Carlos F. Rosa Vzquez Pedro Padilla, president of Padilla Window and Doors CORP, present the following information about the cost behavior of the manufacturing assembly costs. He wants to know and determine how much of the manufacturing assembly cost are fixed and how much variable. Offer the following data asking for your help. Month Mochine Hours Assembly Costs JANUARY 2710 $24.570 FEBRUARY 1,850 19,750 MARCH 1960 21,950 APRIL 1.900 21,100 MAY 1.700 18.000 JUNE 2.600 25,000 JULY 2,600 15,800 AUGUST 2.500 22.800 SEPTEMBER 3,500 27,000 OCTOBER 1,800 19,100 25250 WOVEMEBER 2850 DECEMBER 3,600 29200 Required: 1. Using the High-Low method, determine the: a. Manufacturing assembly variable cost per unit. b. Manufacturing assembly fixed cost c. The resulting cost function d. 1950 machine hours are expected for January, which is the total cost using the cost function of requiremente 2. Complete the table with the following titles Machine Total Hours Assembly X2 Month (M-y? (Y-Y) (Y-??? (XY) 2. A least square regression analysis is required. Determine the: 3. Manufacturing assembly variabile cost per unit. 1 Use the Variable Cost Formula shown is dassroom () - () ) (?) - ()(). 2. Confirm with Lines b. Manufacturing assembly fixed cost 3. Use the Fixed Cost Total shown in the classroom, ) x?)- ()() n(x2) - (X)(EX) Confirm with Intercept c. The resulting cost function d. If 1950 machine hours are expected for January, which is the total cost using the cost function of requirements 3. Determine the goodness of fit a. Square R using the formula shown in classroom R2 = 1 - (Y-y)2 (Y-Y2 b. Interpret the least square result, indicating its limitations 4. Present the corresponding table with the required columns and the Excel Summary Output of the Regression S. Shows the formulas uses in Excel 6. You can use additional papers in order to show calculations for all of the requirements. Dr. Carlos F. Rosa Vzquez


