

Answered step by step
Verified Expert Solution
Question
1 Approved Answer
Percent of change from 2021 to 2022: A B C D E F G J K L Global Manufacturing, Inc. PERCENTAGE CHANGE CALCULATION AND ANALYSIS
Percent of change from 2021 to 2022: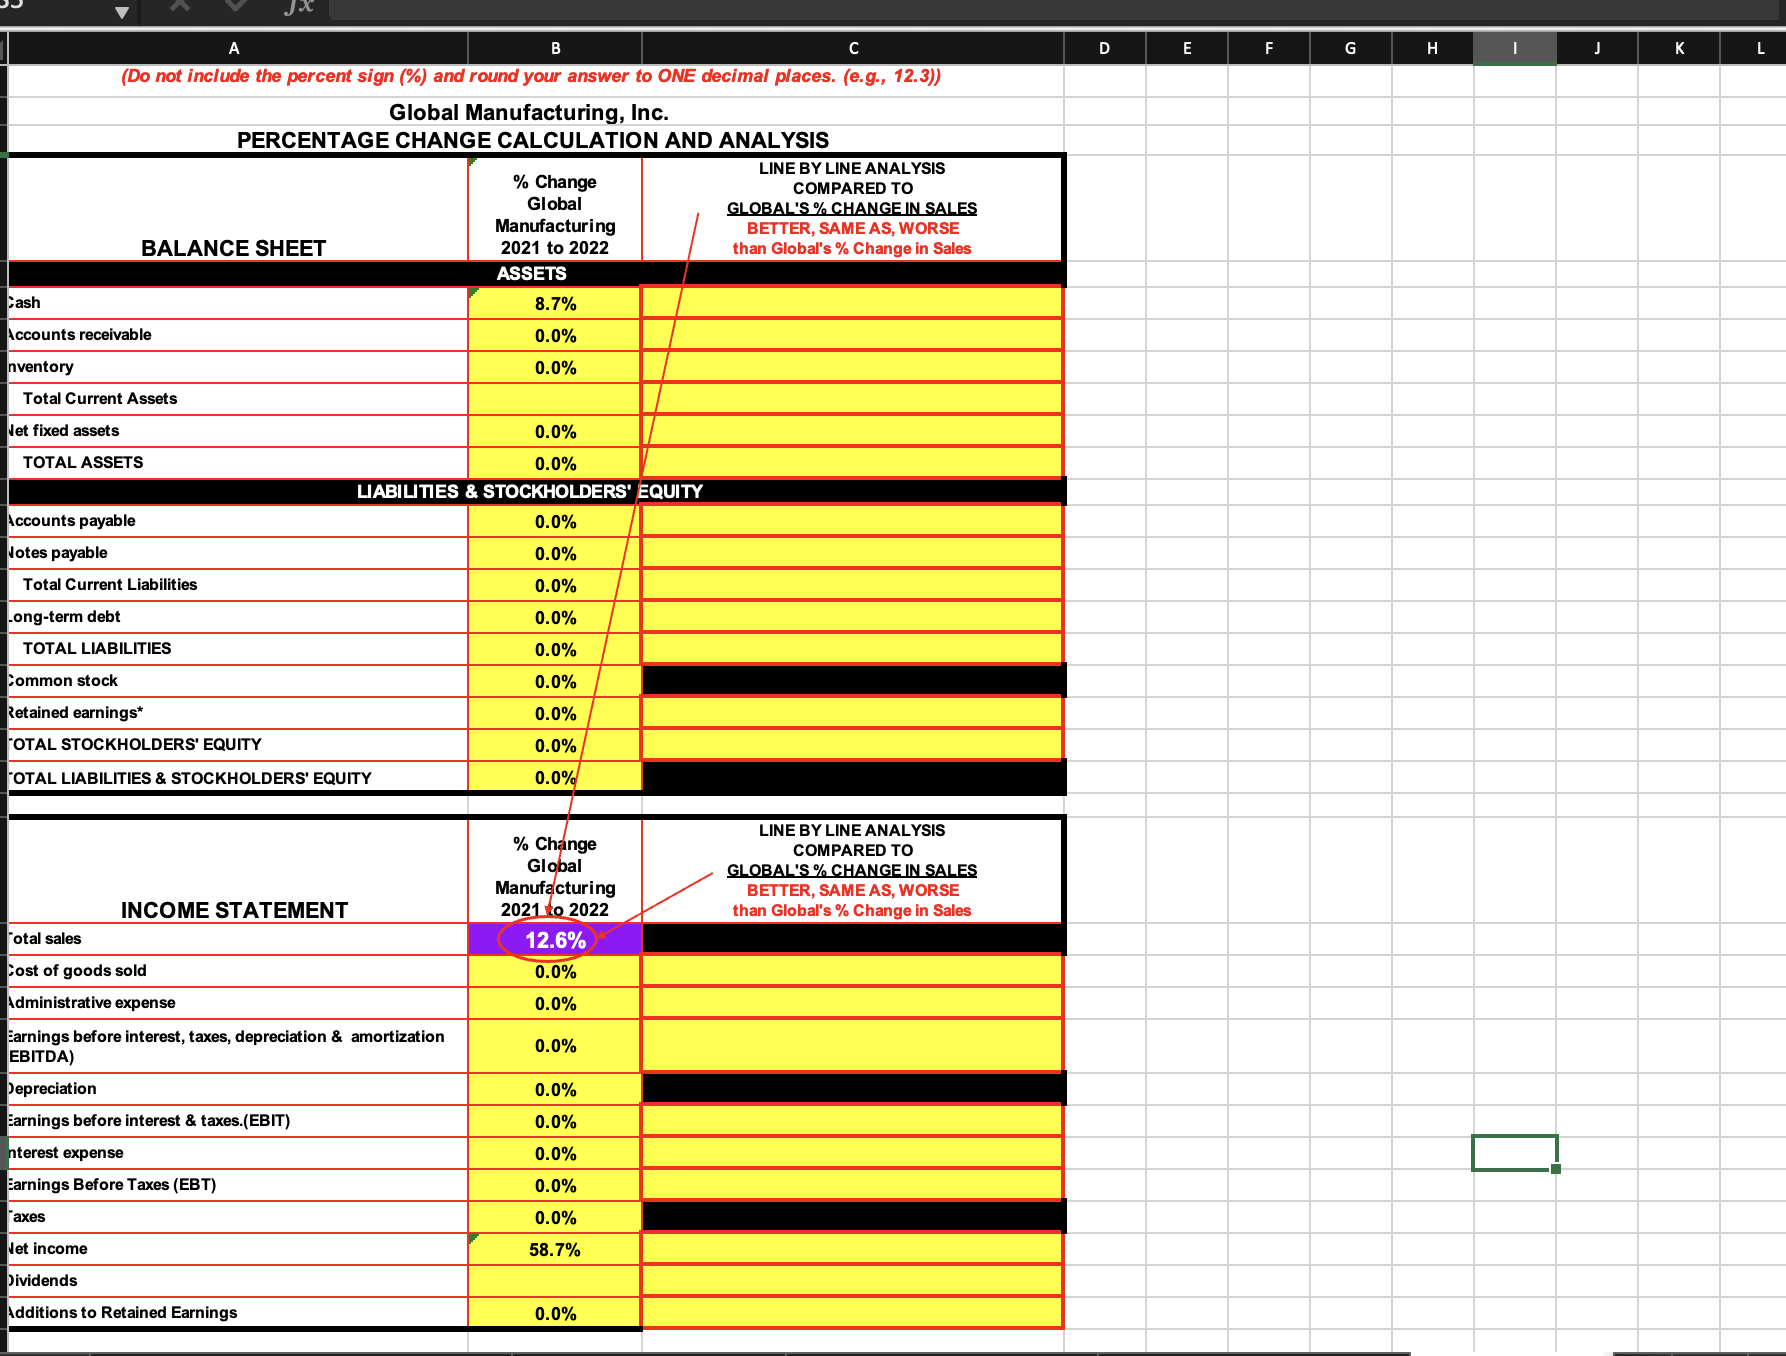
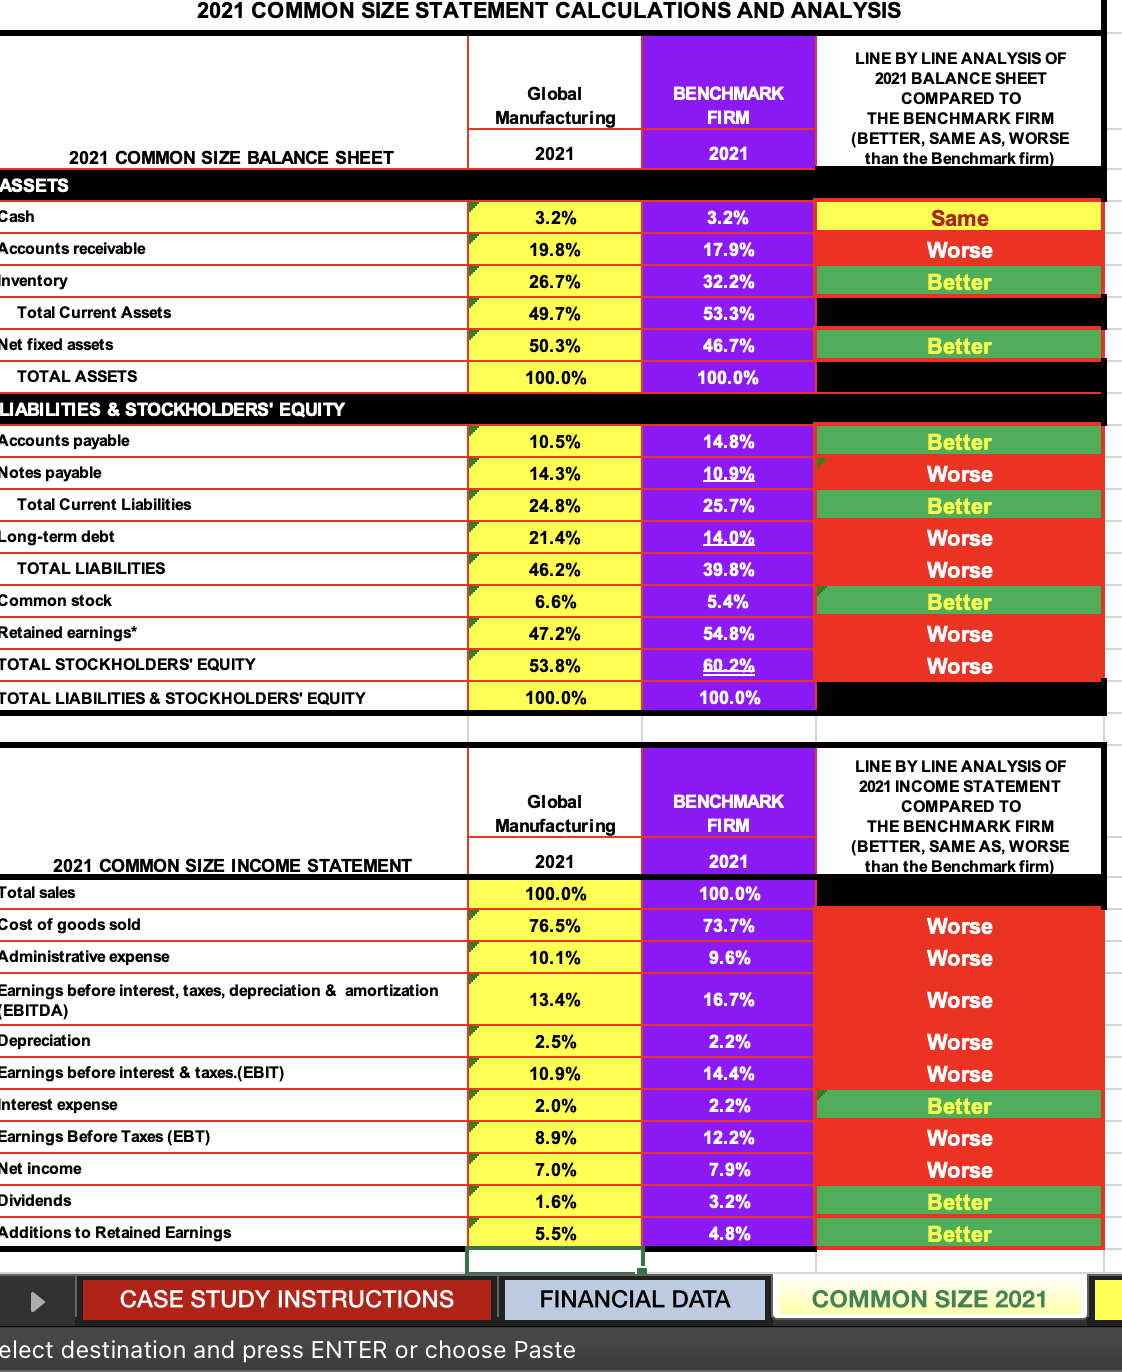
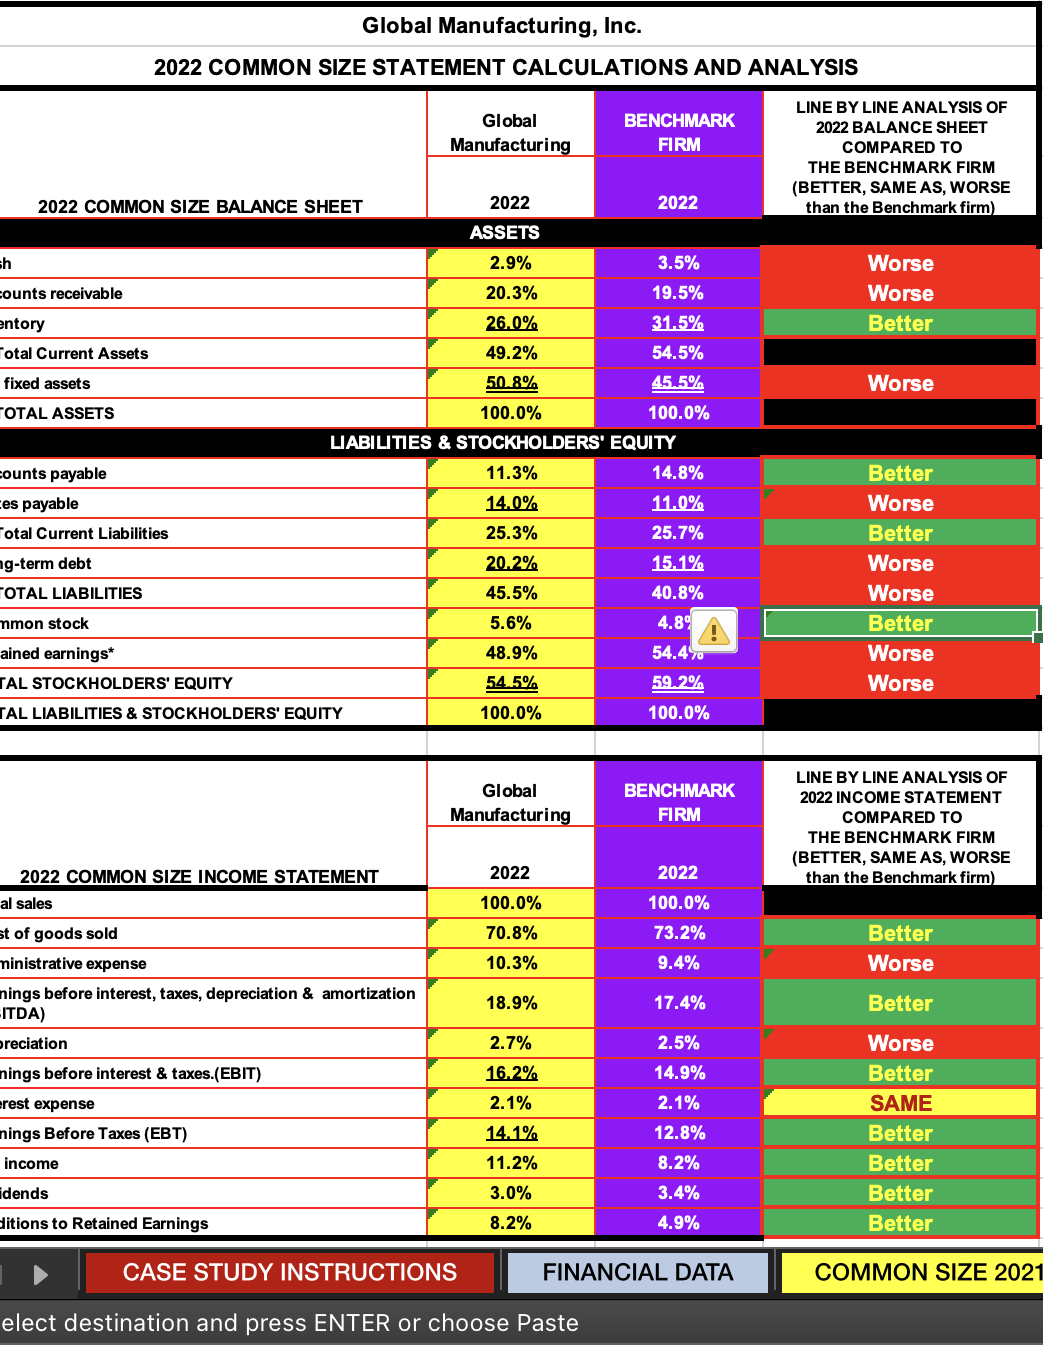 A B C D E F G J K L Global Manufacturing, Inc. PERCENTAGE CHANGE CALCULATION AND ANALYSIS 2021 COMMON SIZE STATEMENT CALCULATIONS AND ANALYSIS LINE BY LINE ANALYSIS OF 2021 BALANCE SHEET COMPARED TO 2021 THE BENCHMARK FIRM (BETTER, SAME AS, WORSE 2021 COMMON SIZE BALANCE SHEET ASSETS cash Total Current Assets let fixed assets TOTAL ASSETS \begin{tabular}{|c|} \hline Manufacturing \\ \hline 2021 \\ \hline 3.2% \\ \hline 19.8% \\ \hline 26.7% \\ \hline 49.7% \\ \hline 50.3% \\ \hline 100.0% \\ \hline \end{tabular} than the Benchmark firm) nventory UABIUTIES \& STOCKHOLDERS' EQUITY Accounts payable Notes payable Total Current Liabilities Long-term debt TOTAL LIABILITIES Common stock Retained earnings TOTAL STOCKHOLDERS' EQUITY TOTAL LIABILITIES \& STOCKHOLDERS' EQUITY LINE BY LINE ANALYSIS OF 2021 INCOME STATEMENT COMPARED TO THE BENCHMARK FIRM (BETTER, SAME AS, WORSE SOP1 COMMON STZE INCOME STATEMENT Administrative expense \begin{tabular}{|c|} \hline 2021 \\ \hline 100.0% \\ \hline 76.5% \\ \hline 10.1% \\ 13.4% \\ \hline 2.5% \\ \hline 10.9% \\ \hline 2.0% \\ \hline 8.9% \\ \hline 7.0% \\ \hline 1.6% \\ \hline 5.5% \\ \hline \end{tabular} 2021 than the Benchmark firm) Cost of goods sold Worse Worse Earnings before interest, taxes, depreciation & amortization Worse (EBITDA) Worse Earnings before interest & taxes.(EBIT) Worse nterest expense Earnings Before Taxes (EBT) Net income Dividends Additions to Retained Earnings FINANCIAL DATA COMMON SIZE 2021 elect destination and press ENTER or choose Paste Global Manufacturing, Inc. 2022 COMMON SIZE STATEMENT CALCULATIONS AND ANALYSIS elect destination and press ENTER or choose Paste A B C D E F G J K L Global Manufacturing, Inc. PERCENTAGE CHANGE CALCULATION AND ANALYSIS 2021 COMMON SIZE STATEMENT CALCULATIONS AND ANALYSIS LINE BY LINE ANALYSIS OF 2021 BALANCE SHEET COMPARED TO 2021 THE BENCHMARK FIRM (BETTER, SAME AS, WORSE 2021 COMMON SIZE BALANCE SHEET ASSETS cash Total Current Assets let fixed assets TOTAL ASSETS \begin{tabular}{|c|} \hline Manufacturing \\ \hline 2021 \\ \hline 3.2% \\ \hline 19.8% \\ \hline 26.7% \\ \hline 49.7% \\ \hline 50.3% \\ \hline 100.0% \\ \hline \end{tabular} than the Benchmark firm) nventory UABIUTIES \& STOCKHOLDERS' EQUITY Accounts payable Notes payable Total Current Liabilities Long-term debt TOTAL LIABILITIES Common stock Retained earnings TOTAL STOCKHOLDERS' EQUITY TOTAL LIABILITIES \& STOCKHOLDERS' EQUITY LINE BY LINE ANALYSIS OF 2021 INCOME STATEMENT COMPARED TO THE BENCHMARK FIRM (BETTER, SAME AS, WORSE SOP1 COMMON STZE INCOME STATEMENT Administrative expense \begin{tabular}{|c|} \hline 2021 \\ \hline 100.0% \\ \hline 76.5% \\ \hline 10.1% \\ 13.4% \\ \hline 2.5% \\ \hline 10.9% \\ \hline 2.0% \\ \hline 8.9% \\ \hline 7.0% \\ \hline 1.6% \\ \hline 5.5% \\ \hline \end{tabular} 2021 than the Benchmark firm) Cost of goods sold Worse Worse Earnings before interest, taxes, depreciation & amortization Worse (EBITDA) Worse Earnings before interest & taxes.(EBIT) Worse nterest expense Earnings Before Taxes (EBT) Net income Dividends Additions to Retained Earnings FINANCIAL DATA COMMON SIZE 2021 elect destination and press ENTER or choose Paste Global Manufacturing, Inc. 2022 COMMON SIZE STATEMENT CALCULATIONS AND ANALYSIS elect destination and press ENTER or choose Paste
 Step by Step Solution
There are 3 Steps involved in it
Step: 1

Get Instant Access to Expert-Tailored Solutions
See step-by-step solutions with expert insights and AI powered tools for academic success
Step: 2

Step: 3
Ace Your Homework with AI
Get the answers you need in no time with our AI-driven, step-by-step assistance
Get Started
Multinational Business Finance
Authors: David K. Eiteman, Arthur I. Stonehill, Michael H. Moffett
13th edition
132743469, 978-0132743464