Answered step by step
Verified Expert Solution
Question
1 Approved Answer
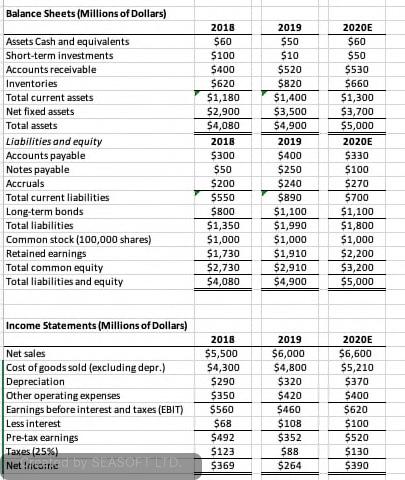
Perform a common size analysis and percentage change analysis. What do these analyses tell you about Computron? Balance Sheets (Millions of Dollars) Assets Cash and

Perform a common size analysis and percentage change analysis. What do these analyses tell you about Computron?
Balance Sheets (Millions of Dollars) Assets Cash and equivalents Short-term investments Accounts receivable Inventories Total current assets Net fixed assets Total assets Liabilities and equity Accounts payable Notes payable Accruals Total current liabilities Long-term bonds Total liabilities Common stock (100,000 shares) Retained earnings Total common equity Total liabilities and equity 2018 $50 $100 5400 5620 $1,180 $2,900 54,080 2018 5300 $50 $200 5550 5800 $1,350 $1,000 $1,730 $2,730 54,080 2019 550 510 $520 5820 $1,400 $3,500 54,900 2019 5400 $250 $240 $890 $1,100 $1,990 $1,000 $1,910 $2,910 $4,900 2020E $60 $50 5530 5660 51,300 53,700 55,000 2020E 5330 $100 5270 5700 $1,100 51,800 51,000 $2,200 $3,200 $5,000 Income Statements (Millions of Dollars) Net sales Cost of goods sold (excluding depr.) Depreciation Other operating expenses Earnings before interest and taxes (EBIT) Less interest Pre-tax earnings Taxes (25%) Net Incored by SEASOFT LTD 2018 55,500 $4,300 5290 $350 $560 $68 5492 5123 5369 2019 $6,000 $4,800 $320 $420 5460 $108 $352 588 $264 2020E 56,600 55,210 5370 $400 $620 5100 5520 $130 $390 Balance Sheets (Millions of Dollars) Assets Cash and equivalents Short-term investments Accounts receivable Inventories Total current assets Net fixed assets Total assets Liabilities and equity Accounts payable Notes payable Accruals Total current liabilities Long-term bonds Total liabilities Common stock (100,000 shares) Retained earnings Total common equity Total liabilities and equity 2018 $50 $100 5400 5620 $1,180 $2,900 54,080 2018 5300 $50 $200 5550 5800 $1,350 $1,000 $1,730 $2,730 54,080 2019 550 510 $520 5820 $1,400 $3,500 54,900 2019 5400 $250 $240 $890 $1,100 $1,990 $1,000 $1,910 $2,910 $4,900 2020E $60 $50 5530 5660 51,300 53,700 55,000 2020E 5330 $100 5270 5700 $1,100 51,800 51,000 $2,200 $3,200 $5,000 Income Statements (Millions of Dollars) Net sales Cost of goods sold (excluding depr.) Depreciation Other operating expenses Earnings before interest and taxes (EBIT) Less interest Pre-tax earnings Taxes (25%) Net Incored by SEASOFT LTD 2018 55,500 $4,300 5290 $350 $560 $68 5492 5123 5369 2019 $6,000 $4,800 $320 $420 5460 $108 $352 588 $264 2020E 56,600 55,210 5370 $400 $620 5100 5520 $130 $390Step by Step Solution
There are 3 Steps involved in it
Step: 1

Get Instant Access to Expert-Tailored Solutions
See step-by-step solutions with expert insights and AI powered tools for academic success
Step: 2

Step: 3

Ace Your Homework with AI
Get the answers you need in no time with our AI-driven, step-by-step assistance
Get Started


