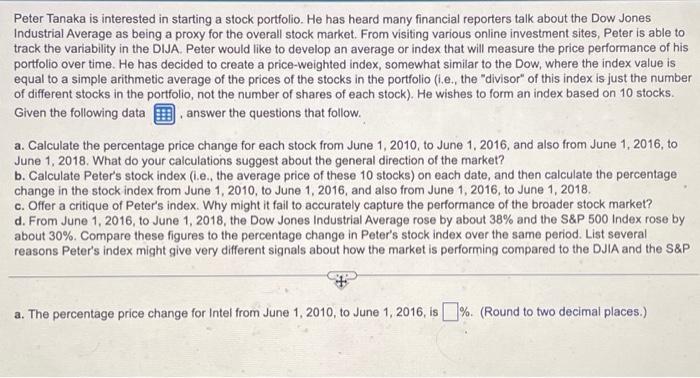
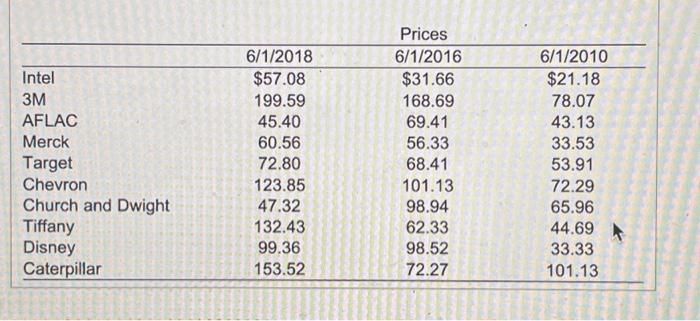
Peter Tanaka is interested in starting a stock portfolio. He has heard many financial reporters talk about the Dow Jones Industrial Average as being a proxy for the overall stock market. From visiting various online investment sites, Peter is able to track the variability in the DIJA. Peter would like to develop an average or index that will measure the price performance of his portfolio over time. He has decided to create a price-weighted index, somewhat similar to the Dow, where the index value is equal to a simple arithmetic average of the prices of the stocks in the portfolio (i.e., the "divisor" of this index is just the number of different stocks in the portfolio, not the number of shares of each stock). He wishes to form an index based on 10 stocks. Given the following data , answer the questions that follow. a. Calculate the percentage price change for each stock from June 1,2010, to June 1,2016, and also from June 1, 2016, to June 1,2018 . What do your calculations suggest about the general direction of the market? b. Calculate Peter's stock index (i.e., the average price of these 10 stocks) on each date, and then calculate the percentage change in the stock index from June 1,2010, to June 1, 2016, and also from June 1, 2016, to June 1, 2018. c. Offer a critique of Peter's index. Why might it fail to accurately capture the performance of the broader stock market? d. From June 1, 2016, to June 1, 2018, the Dow Jones Industrial Average rose by about 38% and the S\&P 500 Index rose by about 30%. Compare these figures to the percentage change in Peter's stock index over the same period. List several reasons Peter's index might give very different signals about how the market is performing compared to the DJIA and the S\&P a. The percentage price change for Intel from June 1,2010 , to June 1,2016 , is %. (Round to two decimal places.) \begin{tabular}{lccc} \hline & \multicolumn{3}{c}{ Prices } \\ \hline Intel & 6/1/2018 & 6/1/2016 & 6/1/2010 \\ 3M & $57.08 & $31.66 & $21.18 \\ AFLAC & 199.59 & 168.69 & 78.07 \\ Merck & 45.40 & 69.41 & 43.13 \\ Target & 60.56 & 56.33 & 33.53 \\ Chevron & 72.80 & 68.41 & 53.91 \\ Church and Dwight & 123.85 & 101.13 & 72.29 \\ Tiffany & 47.32 & 98.94 & 65.96 \\ Disney & 132.43 & 62.33 & 44.69 \\ Caterpillar & 99.36 & 98.52 & 33.33 \\ \hline \end{tabular}


