

Question
Phase I Analyze Hellemn Candys financial statements. Your assistant Dr. Liu already post his analysis results on canvas to save your time. Comment about this
 Phase I
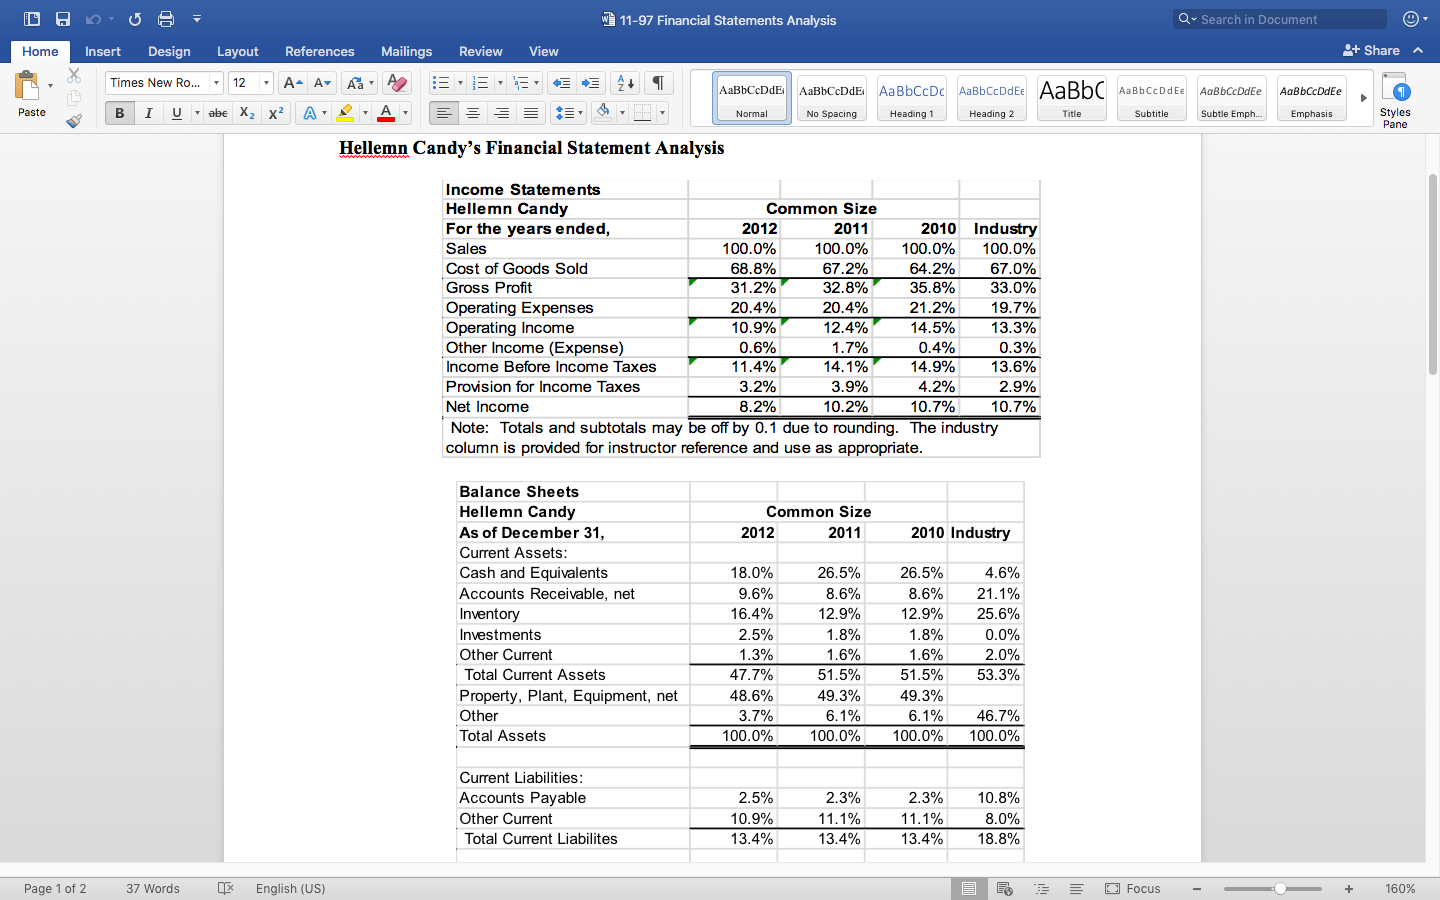
Analyze Hellemn Candys financial statements. Your assistant Dr. Liu already post his analysis results on canvas to save your time.
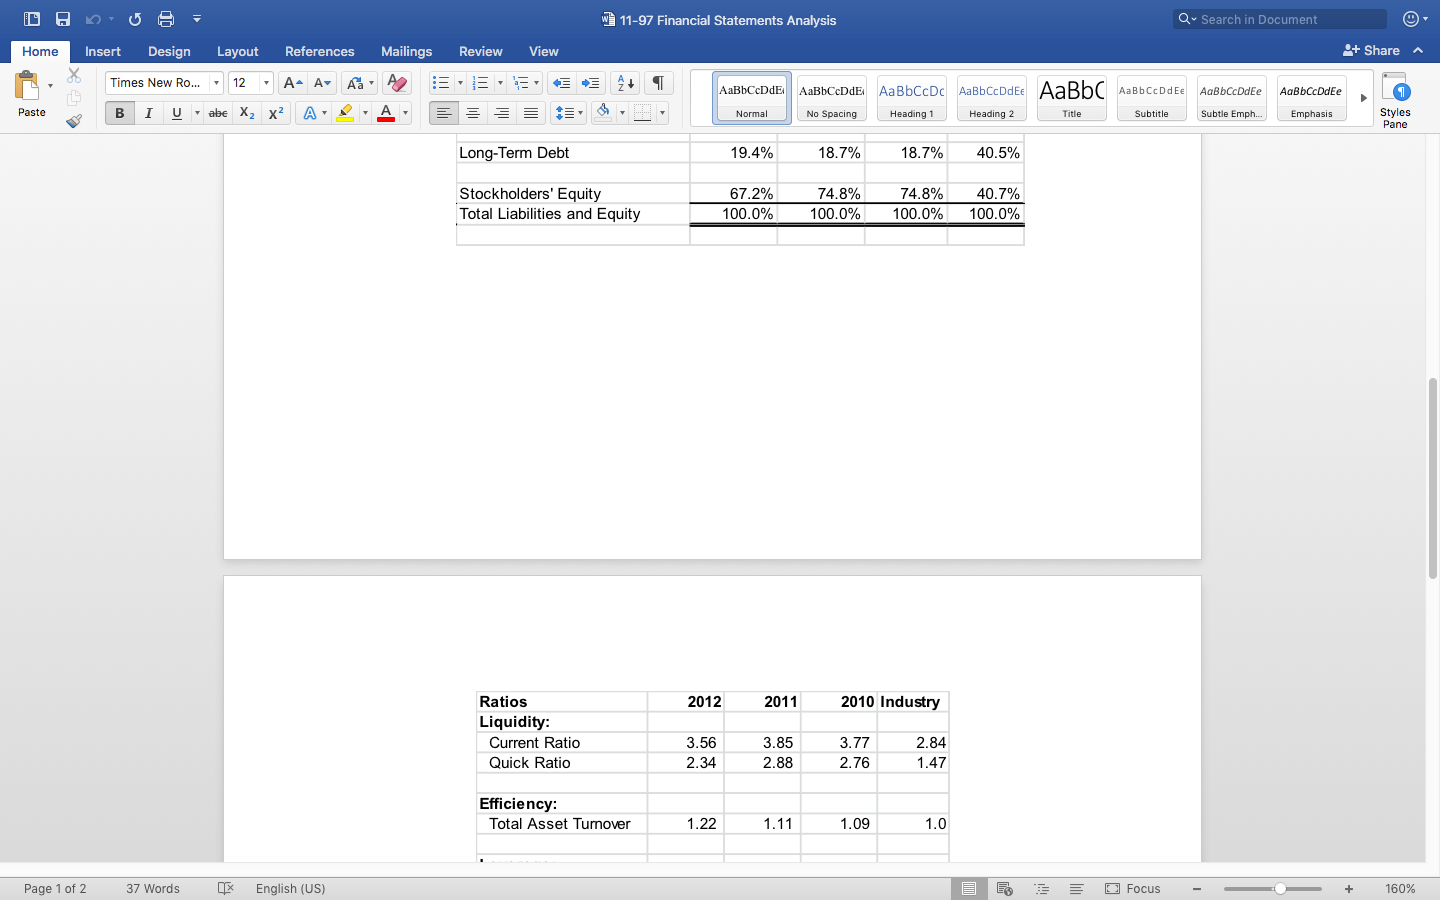
Comment about this companys liquidity, operating efficiency, leverage level, and financial performance based on Dr. Lius and your own analysis of Hellemns financial statements.
Phase II
Use the following table to estimate the cap rate for Hellemn.
| Component | Rate | Reference |
| Risk Free Rate |
| U.S. Treasury Bond Rate |
| Equity Risk Premium |
| Ibbotson SBBI |
| Firm Size Premium |
| Ibbotson SBBI |
| Industry Risk Premium |
| Ibbotson SBBI |
| Specific Company Risk Premium. |
| Forensic Accounting Professional Judgement |
| Required Rate of Return (ROR) |
| foot the rate column |
Note. Based on the Phase I analysis about liquidity, efficiency, performance, and the nature of Hellemn companys lower RD level, fewer new products, and lower buying power comparing to its larger competitors, let us assume that you have decided to give a specific company risk of 1%.
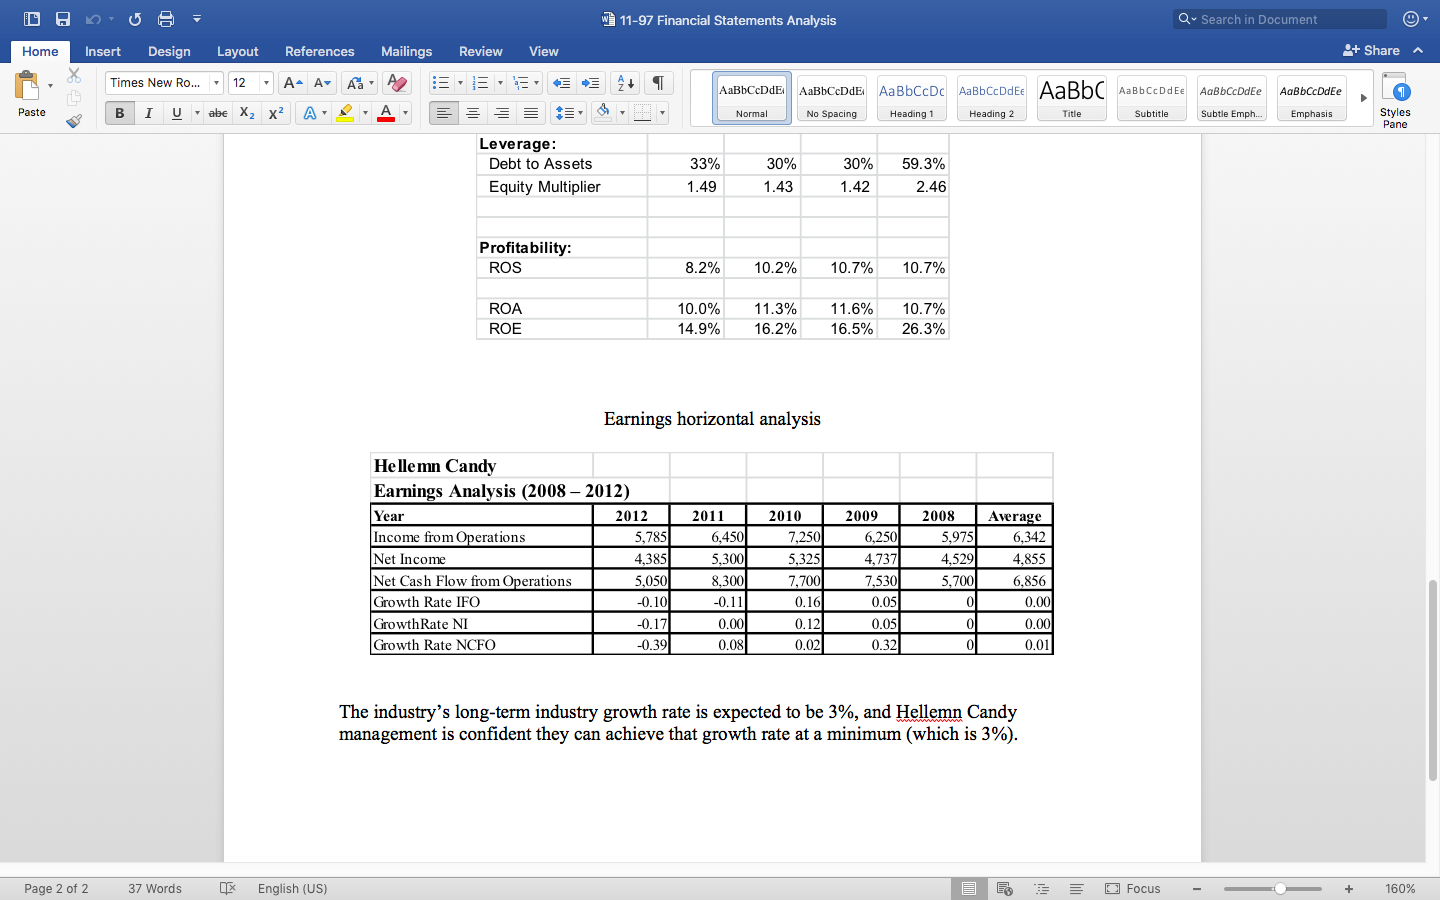
Using the growth rate provided in the financial statement analysis file, and the above rate table to calculate the cap rate for Hellemn.
Phase III, determine a proxy benefit using the average net cash flow for the years from 2008 to 2012. Note: the unit of the net cash flow numbers are thousands of dollars.
Phase IV, determine the indicated value for Hellemn company using the proxy benefit determined from phase three and cap rate determine from phase 2.
w 11-97 Financial Statements Analysis Q- Search in Document Home Insert Design Layout References Mailings Review View 9+ Share Times New Ro... 12 A- A A. A DE A AaBbCcDde AaBbCeDdE AaBbccDc AabbCcDdEe AaBbc Aabbccddee AaBbCcDdEe AaBbCcDdEe Emphasis Paste B Uabe Xx2 A Normal No Spacing Heading 1 Heading 2 Title Subtitle Subtle Emph.. Styles Pane Hellemn Candy's Financial Statement Analysis Income Statements Hellemn Candy Common Size For the years ended, 2012 2011 2010 Industry Sales 100.0% 100.0% 100.0% 100.0% Cost of Goods Sold 68.8% 67.2% 64.2% 67.0% Gross Profit 31.2% 32.8% 35.8% 33.0% Operating Expenses 20.4% 20.4% 21.2% 19.7% Operating Income 12.4% 14.5% 13.3% Other Income (Expense) 0.6% 1.7% 0.4% 0.3% Income Before Income Taxes 11.4% 14.1% 14.9% 13.6% Provision for Income Taxes 3.2% 3.9% 4.2% 2.9% Net Income 8.2% 10.2% 10.7% 10.7% Note: Totals and subtotals may be off by 0.1 due to rounding. The industry column is provided for instructor reference and use as appropriate. 10.9% Common Size 2012 2011 2010 Industry Balance Sheets Hellemn Candy As of December 31, Current Assets: Cash and Equivalents Accounts Receivable, net Inventory Investments Other Current Total Current Assets Property, Plant, Equipment, net Other Total Assets 18.0% 9.6% 16.4% 2.5% 1.3% 47.7% 48.6% 3.7% 100.0% 26.5% 8.6% 12.9% 1.8% 1.6% 51.5% 49.3% 6.1% 100.0% 26.5% 8.6% 12.9% 1.8% 1.6% 51.5% 49.3% 6.1% 100.0% 4.6% 21.1% 25.6% 0.0% 2.0% 53.3% 46.7% 100.0% Current Liabilities: Accounts Payable Other Current Total Current Liabilites 2.5% 10.9% 13.4% 2.3% 11.1% 13.4% 2.3% 11.1% 13.4% 10.8% 8.0% 18.8% Page 1 of 2 37 Words x English (US) E D Focus + 160% w 11-97 Financial Statements Analysis Q- Search in Document Home Insert Design Layout References Mailings Review View 9+ Share Times New Ro... 12 A- A A. ** A+ AaBbCeDdE AaBbCcDde. AaBbCcDc AabbCcDdEe AaBbc Aabbccddee AaBbccddie AaBbCcDdEe Emphasis Paste B Uabe Xx2 A Normal No Spacing Heading 1 Heading 2 Title Subtitle Subtle Emph.. Styles Pane Long-Term Debt 19.4% 18.7% 18.7% 40.5% Stockholders' Equity Total Liabilities and Equity 67.2% 100.0% 74.8% 100.0% 74.8% 100.0% 40.7% 100.0% 2012 2011 2010 Industry Ratios Liquidity: Current Ratio Quick Ratio 3.56 2.34 3.85 2.88 3.77 2.76 2.84 1.47 Efficiency: Total Asset Turnover 1.22 1.11 1.09 1.0 Page 1 of 2 37 Words x English (US) O Focus + 160% w 11-97 Financial Statements Analysis Q- Search in Document Home Insert Design Layout References Mailings Review View 9+ Share Times New Ro... 12 A- A A. PE E A+ AaBbCcDde AaBbCeDdE AaBbccDc AabbCcDdEe AaBbc Aabbccddee AaBbCcDdEe AaBbCcDdEe Emphasis Paste B Uabe Xx2 A Normal No Spacing Heading 1 Heading 2 Title Subtitle Subtle Emph.. Styles Pane Leverage: Debt to Assets Equity Multiplier 33% 1.49 30% 1.43 30% 1.42 59.3% 2.46 Profitability: ROS 8.2% 10.2% 10.7% 10.7% ROA ROE 10.0% 14.9% 11.3% 16.2% 11.6% 16.5% 10.7% 26.3% Earnings horizontal analysis Hellemn Candy Earnings Analysis (2008 2012) Year 2012 Income from Operations 5,785 Net Income 4,385 Net Cash Flow from Operations Growth Rate IFO -0.10 Growth Rate NI -0.17 Growth Rate NCFO -0.391 2011 6,450 5,300 2009 6,250 4,737 2008 5,975 4,529 5,700 2010 7,250 5,325 7,700 0.16 0.12 0.021 Average 6,342 4,855 6,856 0.001 5,050 8,300 7,530 -0.11 0 0.05 0.05 0.321 0.00 0.08 0 0.00 0.01 The industry's long-term industry growth rate is expected to be 3%, and Hellemn Candy management is confident they can achieve that growth rate at a minimum (which is 3%). Page 2 of 2 37 Words X English (US) E Focus + 160% w 11-97 Financial Statements Analysis Q- Search in Document Home Insert Design Layout References Mailings Review View 9+ Share Times New Ro... 12 A- A A. A DE A AaBbCcDde AaBbCeDdE AaBbccDc AabbCcDdEe AaBbc Aabbccddee AaBbCcDdEe AaBbCcDdEe Emphasis Paste B Uabe Xx2 A Normal No Spacing Heading 1 Heading 2 Title Subtitle Subtle Emph.. Styles Pane Hellemn Candy's Financial Statement Analysis Income Statements Hellemn Candy Common Size For the years ended, 2012 2011 2010 Industry Sales 100.0% 100.0% 100.0% 100.0% Cost of Goods Sold 68.8% 67.2% 64.2% 67.0% Gross Profit 31.2% 32.8% 35.8% 33.0% Operating Expenses 20.4% 20.4% 21.2% 19.7% Operating Income 12.4% 14.5% 13.3% Other Income (Expense) 0.6% 1.7% 0.4% 0.3% Income Before Income Taxes 11.4% 14.1% 14.9% 13.6% Provision for Income Taxes 3.2% 3.9% 4.2% 2.9% Net Income 8.2% 10.2% 10.7% 10.7% Note: Totals and subtotals may be off by 0.1 due to rounding. The industry column is provided for instructor reference and use as appropriate. 10.9% Common Size 2012 2011 2010 Industry Balance Sheets Hellemn Candy As of December 31, Current Assets: Cash and Equivalents Accounts Receivable, net Inventory Investments Other Current Total Current Assets Property, Plant, Equipment, net Other Total Assets 18.0% 9.6% 16.4% 2.5% 1.3% 47.7% 48.6% 3.7% 100.0% 26.5% 8.6% 12.9% 1.8% 1.6% 51.5% 49.3% 6.1% 100.0% 26.5% 8.6% 12.9% 1.8% 1.6% 51.5% 49.3% 6.1% 100.0% 4.6% 21.1% 25.6% 0.0% 2.0% 53.3% 46.7% 100.0% Current Liabilities: Accounts Payable Other Current Total Current Liabilites 2.5% 10.9% 13.4% 2.3% 11.1% 13.4% 2.3% 11.1% 13.4% 10.8% 8.0% 18.8% Page 1 of 2 37 Words x English (US) E D Focus + 160% w 11-97 Financial Statements Analysis Q- Search in Document Home Insert Design Layout References Mailings Review View 9+ Share Times New Ro... 12 A- A A. ** A+ AaBbCeDdE AaBbCcDde. AaBbCcDc AabbCcDdEe AaBbc Aabbccddee AaBbccddie AaBbCcDdEe Emphasis Paste B Uabe Xx2 A Normal No Spacing Heading 1 Heading 2 Title Subtitle Subtle Emph.. Styles Pane Long-Term Debt 19.4% 18.7% 18.7% 40.5% Stockholders' Equity Total Liabilities and Equity 67.2% 100.0% 74.8% 100.0% 74.8% 100.0% 40.7% 100.0% 2012 2011 2010 Industry Ratios Liquidity: Current Ratio Quick Ratio 3.56 2.34 3.85 2.88 3.77 2.76 2.84 1.47 Efficiency: Total Asset Turnover 1.22 1.11 1.09 1.0 Page 1 of 2 37 Words x English (US) O Focus + 160% w 11-97 Financial Statements Analysis Q- Search in Document Home Insert Design Layout References Mailings Review View 9+ Share Times New Ro... 12 A- A A. PE E A+ AaBbCcDde AaBbCeDdE AaBbccDc AabbCcDdEe AaBbc Aabbccddee AaBbCcDdEe AaBbCcDdEe Emphasis Paste B Uabe Xx2 A Normal No Spacing Heading 1 Heading 2 Title Subtitle Subtle Emph.. Styles Pane Leverage: Debt to Assets Equity Multiplier 33% 1.49 30% 1.43 30% 1.42 59.3% 2.46 Profitability: ROS 8.2% 10.2% 10.7% 10.7% ROA ROE 10.0% 14.9% 11.3% 16.2% 11.6% 16.5% 10.7% 26.3% Earnings horizontal analysis Hellemn Candy Earnings Analysis (2008 2012) Year 2012 Income from Operations 5,785 Net Income 4,385 Net Cash Flow from Operations Growth Rate IFO -0.10 Growth Rate NI -0.17 Growth Rate NCFO -0.391 2011 6,450 5,300 2009 6,250 4,737 2008 5,975 4,529 5,700 2010 7,250 5,325 7,700 0.16 0.12 0.021 Average 6,342 4,855 6,856 0.001 5,050 8,300 7,530 -0.11 0 0.05 0.05 0.321 0.00 0.08 0 0.00 0.01 The industry's long-term industry growth rate is expected to be 3%, and Hellemn Candy management is confident they can achieve that growth rate at a minimum (which is 3%). Page 2 of 2 37 Words X English (US) E Focus + 160%Step by Step Solution
There are 3 Steps involved in it
Step: 1

Get Instant Access to Expert-Tailored Solutions
See step-by-step solutions with expert insights and AI powered tools for academic success
Step: 2

Step: 3
Ace Your Homework with AI
Get the answers you need in no time with our AI-driven, step-by-step assistance
Get Started
Safe Guarding Your Future Financial Literacy How A Trusts Can Shield Your Assets And Reduce Taxes
Authors: Victor Alexis Avila Jimenez
1st Edition
979-8853485969