

Question
Phelps Toy Company The Phelps Toy Company was considering the advisability of adding a new product to its line. Ike Barnes was in charge of
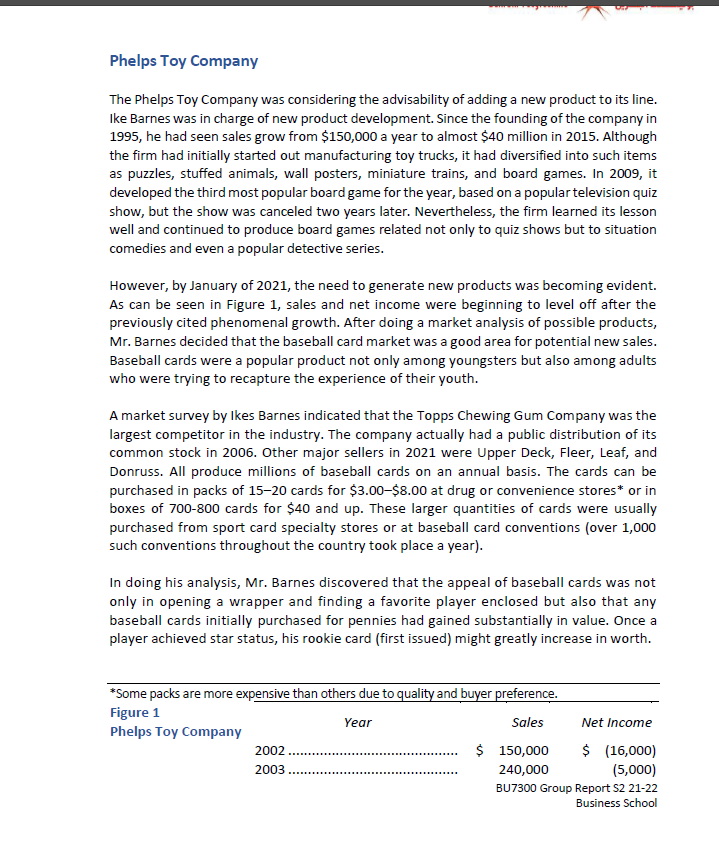
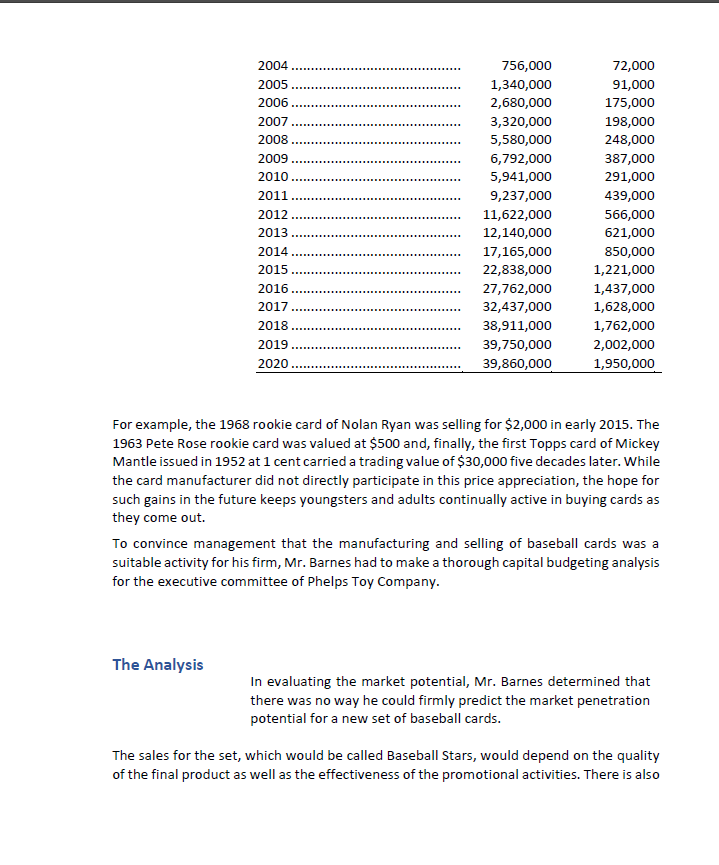
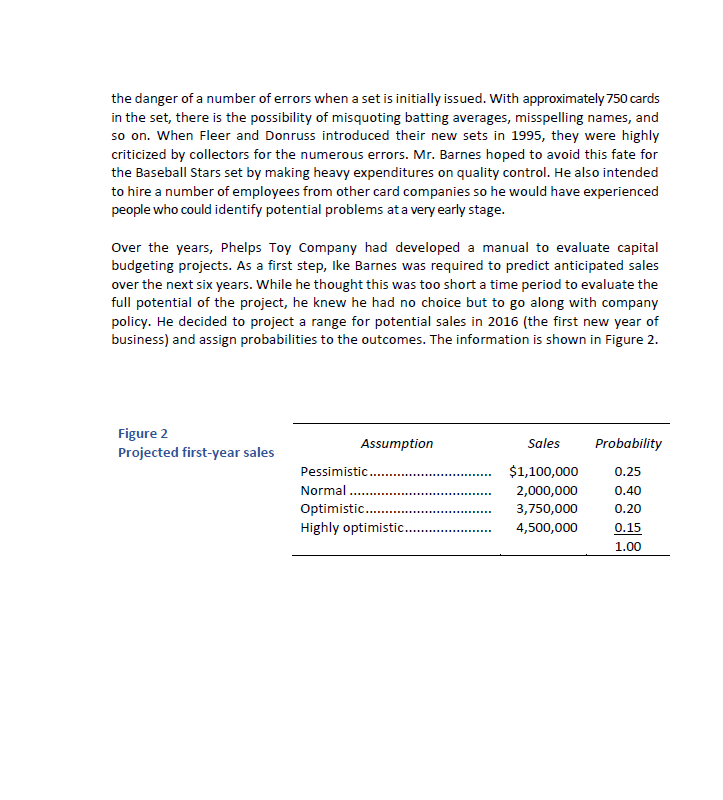
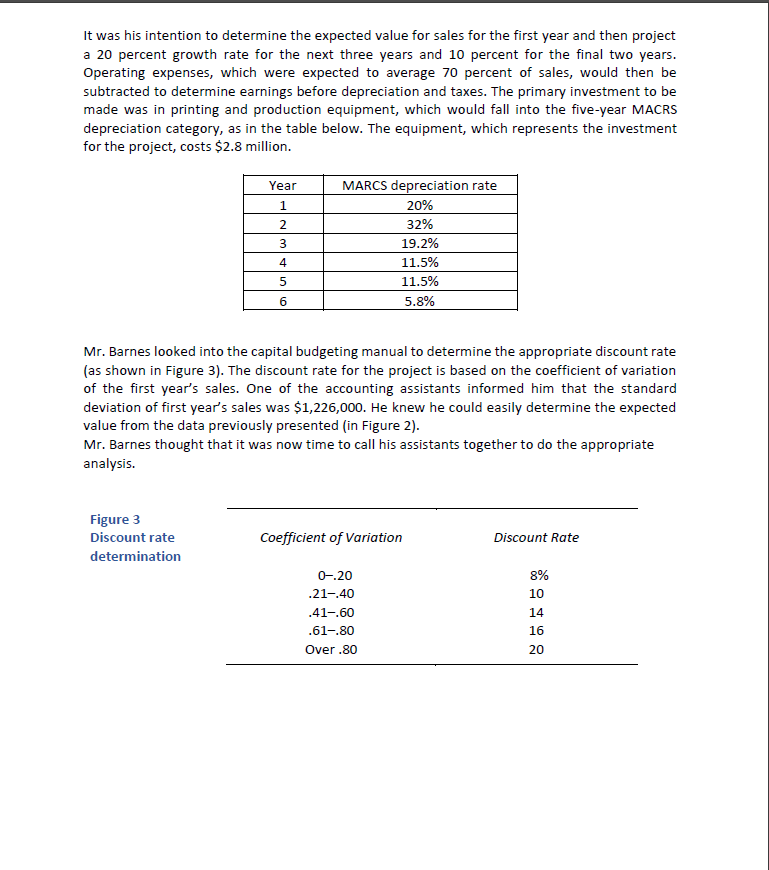
Phelps Toy Company The Phelps Toy Company was considering the advisability of adding a new product to its line. Ike Barnes was in charge of new product development. Since the founding of the company in 1995, he had seen sales grow from $150,000 a year to almost $40 million in 2015. Although the firm had initially started out manufacturing toy trucks, it had diversified into such items as puzzles, stuffed animals, wall posters, miniature trains, and board games. In 2009, it developed the third most popular board game for the year, based on a popular television quiz show, but the show was canceled two years later. Nevertheless, the firm learned its lesson well and continued to produce board games related not only to quiz shows but to situation comedies and even a popular detective series. However, by January of 2021, the need to generate new products was becoming evident. As can be seen in Figure 1, sales and net income were beginning to level off after the previously cited phenomenal growth. After doing a market analysis of possible products, Mr. Barnes decided that the baseball card market was a good area for potential new sales. Baseball cards were a popular product not only among youngsters but also among adults who were trying to recapture the experience of their youth. A market survey by Ikes Barnes indicated that the Topps Chewing Gum Company was the largest competitor in the industry. The company actually had a public distribution of its common stock in 2006. Other major sellers in 2021 were Upper Deck, Fleer, Leaf, and Donruss. All produce millions of baseball cards on an annual basis. The cards can be purchased in packs of 1520 cards for $3.00$8.00 at drug or convenience stores* or in boxes of 700-800 cards for $40 and up. These larger quantities of cards were usually purchased from sport card specialty stores or at baseball card conventions (over 1,000 such conventions throughout the country took place a year). In doing his analysis, Mr. Barnes discovered that the appeal of baseball cards was not only in opening a wrapper and finding a favorite player enclosed but also that any baseball cards initially purchased for pennies had gained substantially in value. Once a player achieved star status, his rookie card (first issued) might greatly increase in worth. *Some packs are more expensive than others due to quality and buyer preference. Figure 1 Phelps Toy Company Year Sales Net Income 2002 ........................................... $ 150,000 $ (16,000 ) 2003 ........................................... 240,000 (5,000 ) 2004 ........................................... 756,000 72,000 2005 ........................................... 1,340,000 91,000 2006 ........................................... 2,680,000 175,000 2007 ........................................... 3,320,000 198,000 2008 ........................................... 5,580,000 248,000 2009 ........................................... 6,792,000 387,000 2010 ........................................... 5,941,000 291,000 2011 ........................................... 9,237,000 439,000 2012 ........................................... 11,622,000 566,000 2013 ........................................... 12,140,000 621,000 2014 ........................................... 17,165,000 850,000 2015 ........................................... 22,838,000 1,221,000 2016 ........................................... 27,762,000 1,437,000 2017 ........................................... 32,437,000 1,628,000 2018 ........................................... 38,911,000 1,762,000 2019 ........................................... 39,750,000 2,002,000 2020 ........................................... 39,860,000 1,950,000 For example, the 1968 rookie card of Nolan Ryan was selling for $2,000 in early 2015. The 1963 Pete Rose rookie card was valued at $500 and, finally, the first Topps card of Mickey Mantle issued in 1952 at 1 cent carried a trading value of $30,000 five decades later. While the card manufacturer did not directly participate in this price appreciation, the hope for such gains in the future keeps youngsters and adults continually active in buying cards as they come out. To convince management that the manufacturing and selling of baseball cards was a suitable activity for his firm, Mr. Barnes had to make a thorough capital budgeting analysis for the executive committee of Phelps Toy Company. The Analysis In evaluating the market potential, Mr. Barnes determined that there was no way he could firmly predict the market penetration potential for a new set of baseball cards. The sales for the set, which would be called Baseball Stars, would depend on the quality of the final product as well as the effectiveness of the promotional activities. There is also the danger of a number of errors when a set is initially issued. With approximately 750 cards in the set, there is the possibility of misquoting batting averages, misspelling names, and so on. When Fleer and Donruss introduced their new sets in 1995, they were highly criticized by collectors for the numerous errors. Mr. Barnes hoped to avoid this fate for the Baseball Stars set by making heavy expenditures on quality control. He also intended to hire a number of employees from other card companies so he would have experienced people who could identify potential problems at a very early stage. Over the years, Phelps Toy Company had developed a manual to evaluate capital budgeting projects. As a first step, Ike Barnes was required to predict anticipated sales over the next six years. While he thought this was too short a time period to evaluate the full potential of the project, he knew he had no choice but to go along with company policy. He decided to project a range for potential sales in 2016 (the first new year of business) and assign probabilities to the outcomes. The information is shown in Figure 2. Figure 2 Projected first-year sales Assumption Sales Probability Pessimistic ............................... $1,100,000 0.25 Normal .................................... 2,000,000 0.40 Optimistic ................................ 3,750,000 0.20 Highly optimistic ...................... 4,500,000 0.15 1.00 It was his intention to determine the expected value for sales for the first year and then project a 20 percent growth rate for the next three years and 10 percent for the final two years. Operating expenses, which were expected to average 70 percent of sales, would then be subtracted to determine earnings before depreciation and taxes. The primary investment to be made was in printing and production equipment, which would fall into the five-year MACRS depreciation category, as in the table below. The equipment, which represents the investment for the project, costs $2.8 million. Mr. Barnes looked into the capital budgeting manual to determine the appropriate discount rate (as shown in Figure 3). The discount rate for the project is based on the coefficient of variation of the first years sales. One of the accounting assistants informed him that the standard deviation of first years sales was $1,226,000. He knew he could easily determine the expected value from the data previously presented (in Figure 2). Mr. Barnes thought that it was now time to call his assistants together to do the appropriate analysis. Figure 3 Discount rate determination Coefficient of Variation Discount Rate 0.20 8% .21.40 10 .41.60 14 .61.80 16 Over .80 20 Year MARCS depreciation rate 1 20% 2 32% 3 19.2% 4 11.5% 5 11.5% 6 5.8% Required: 1. First determine the expected value of the first years sales. 2. Then project sales for the next 5 years 3. Next determine the annual depreciation over the 6 years 4. Then combine the data into a table and calculate the cash flow for the five years. 5. To determine earnings before depreciation and taxes (EBDT), subtract projected operating expenses from projected sales. Use a tax rate of 34 percent. 6. Determine the appropriate discount rate for the firm. 7. Make a decision on whether the project is feasible, based on net present value analysis. 8. What is the drawback to using a six-year time horizon for the project?
Phelps Toy Company The Phelps Toy Company was considering the advisability of adding a new product to its line. Ike Barnes was in charge of new product development. Since the founding of the company in 1995, he had seen sales grow from $150,000 a year to almost $40 million in 2015. Although the firm had initially started out manufacturing toy trucks, it had diversified into such items as puzzles, stuffed animals, wall posters, miniature trains, and board games. In 2009, it developed the third most popular board game for the year, based on a popular television quiz show, but the show was canceled two years later. Nevertheless, the firm learned its lesson well and continued to produce board games related not only to quiz shows but to situation comedies and even a popular detective series. However, by January of 2021, the need to generate new products was becoming evident. As can be seen in Figure 1, sales and net income were beginning to level off after the previously cited phenomenal growth. After doing a market analysis of possible products, Mr. Barnes decided that the baseball card market was a good area for potential new sales. Baseball cards were a popular product not only among youngsters but also among adults who were trying to recapture the experience of their youth. A market survey by Ikes Barnes indicated that the Topps Chewing Gum Company was the largest competitor in the industry. The company actually had a public distribution of its common stock in 2006. Other major sellers in 2021 were Upper Deck, Fleer, Leaf, and Donruss. All produce millions of baseball cards on an annual basis. The cards can be purchased in packs of 15-20 cards for $3.00-$8.00 at drug or convenience stores* or in boxes of 700-800 cards for $40 and up. These larger quantities of cards were usually purchased from sport card specialty stores or at baseball card conventions (over 1,000 such conventions throughout the country took place a year). In doing his analysis, Mr. Barnes discovered that the appeal of baseball cards was not only in opening a wrapper and finding a favorite player enclosed but also that any baseball cards initially purchased for pennies had gained substantially in value. Once a player achieved star status, his rookie card (first issued) might greatly increase in worth. *Some packs are more expensive than others due to quality and buyer preference. Figure 1 Year Sales Net Income Phelps Toy Company 2002 $ 150,000 $ (16,000) 2003 240,000 (5,000) BU7300 Group Report $2 21-22 Business School 2004 756,000 72,000 2005 1,340,000 91,000 2006 2,680,000 175,000 2007 3,320,000 198,000 2008 5,580,000 248,000 2009 6,792,000 387,000 2010 5,941,000 291,000 2011 9,237,000 439,000 2012 11,622,000 566,000 2013 12,140,000 621,000 2014 17,165,000 850,000 2015 22,838,000 1,221,000 2016 27,762,000 1,437,000 2017 32,437,000 1,628,000 2018 38,911,000 1,762,000 2019 39,750,000 2,002,000 2020 39,860,000 1,950,000 For example, the 1968 rookie card of Nolan Ryan was selling for $2,000 in early 2015. The 1963 Pete Rose rookie card was valued at $500 and, finally, the first Topps card of Mickey Mantle issued in 1952 at 1 cent carried a trading value of $30,000 five decades later. While the card manufacturer did not directly participate in this price appreciation, the hope for such gains in the future keeps youngsters and adults continually active in buying cards as they come out. To convince management that the manufacturing and selling of baseball cards was a suitable activity for his firm, Mr. Barnes had to make a thorough capital budgeting analysis for the executive committee of Phelps Toy Company. The Analysis In evaluating the market potential, Mr. Barnes determined that there was no way he could firmly predict the market penetration potential for a new set of baseball cards. The sales for the set, which would be called Baseball Stars, would depend on the quality of the final product as well as the effectiveness of the promotional activities. There is also the danger of a number of errors when a set is initially issued. With approximately 750 cards in the set, there is the possibility of misquoting batting averages, misspelling names, and so on. When Fleer and Donruss introduced their new sets in 1995, they were highly criticized by collectors for the numerous errors. Mr. Barnes hoped to avoid this fate for the Baseball Stars set by making heavy expenditures on quality control. He also intended to hire a number of employees from other card companies so he would have experienced people who could identify potential problems at a very early stage. Over the years, Phelps Toy Company had developed a manual to evaluate capital budgeting projects. As a first step, Ike Barnes was required to predict anticipated sales over the next six years. While he thought this was too short a time period to evaluate the full potential of the project, he knew he had no choice but to go along with company policy. He decided to project a range for potential sales in 2016 (the first new year of business) and assign probabilities to the outcomes. The information is shown in Figure 2. Figure 2 Assumption Sales Probability Projected first-year sales Pessimistic. $1,100,000 0.25 Normal 2,000,000 0.40 Optimistic... 3,750,000 0.20 Highly optimistic....... 4,500,000 0.15 1.00 It was his intention to determine the expected value for sales for the first year and then project a 20 percent growth rate for the next three years and 10 percent for the final two years. Operating expenses, which were expected to average 70 percent of sales, would then be subtracted to determine earnings before depreciation and taxes. The primary investment to be made was in printing and production equipment, which would fall into the five-year MACRS depreciation category, as in the table below. The equipment, which represents the investment for the project, costs $2.8 million. Year MARCS depreciation rate 1 20% 32% 19.2% 11.5% 5 11.5% 6 5.8% Mr. Barnes looked into the capital budgeting manual to determine the appropriate discount rate (as shown in Figure 3). The discount rate for the project is based on the coefficient of variation of the first year's sales. One of the accounting assistants informed him that the standard deviation of first year's sales was $1,226,000. He knew he could easily determine the expected value from the data previously presented (in Figure 2). Mr. Barnes thought that it was now time to call his assistants together to do the appropriate analysis. Figure 3 Coefficient of Variation Discount Rate Discount rate determination 0-.20 8% .21-.40 10 .41-.60 14 .61-.80 16 Over .80 20 2 3 4 Required: 1. First determine the expected value of the first year's sales. 2. Then project sales for the next 5 years 3. Next determine the annual depreciation over the 6 years 4. Then combine the data into a table and calculate the cash flow for the five years. 5. To determine earnings before depreciation and taxes (EBDT), subtract projected operating expenses from projected sales. Use a tax rate of 34 percent. 6. Determine the appropriate discount rate for the firm. 7. Make a decision on whether the project is feasible, based on net present value analysis. 8. What is the drawback to using a six-year time horizon for the project? Phelps Toy Company The Phelps Toy Company was considering the advisability of adding a new product to its line. Ike Barnes was in charge of new product development. Since the founding of the company in 1995, he had seen sales grow from $150,000 a year to almost $40 million in 2015. Although the firm had initially started out manufacturing toy trucks, it had diversified into such items as puzzles, stuffed animals, wall posters, miniature trains, and board games. In 2009, it developed the third most popular board game for the year, based on a popular television quiz show, but the show was canceled two years later. Nevertheless, the firm learned its lesson well and continued to produce board games related not only to quiz shows but to situation comedies and even a popular detective series. However, by January of 2021, the need to generate new products was becoming evident. As can be seen in Figure 1, sales and net income were beginning to level off after the previously cited phenomenal growth. After doing a market analysis of possible products, Mr. Barnes decided that the baseball card market was a good area for potential new sales. Baseball cards were a popular product not only among youngsters but also among adults who were trying to recapture the experience of their youth. A market survey by Ikes Barnes indicated that the Topps Chewing Gum Company was the largest competitor in the industry. The company actually had a public distribution of its common stock in 2006. Other major sellers in 2021 were Upper Deck, Fleer, Leaf, and Donruss. All produce millions of baseball cards on an annual basis. The cards can be purchased in packs of 15-20 cards for $3.00-$8.00 at drug or convenience stores* or in boxes of 700-800 cards for $40 and up. These larger quantities of cards were usually purchased from sport card specialty stores or at baseball card conventions (over 1,000 such conventions throughout the country took place a year). In doing his analysis, Mr. Barnes discovered that the appeal of baseball cards was not only in opening a wrapper and finding a favorite player enclosed but also that any baseball cards initially purchased for pennies had gained substantially in value. Once a player achieved star status, his rookie card (first issued) might greatly increase in worth. *Some packs are more expensive than others due to quality and buyer preference. Figure 1 Year Sales Net Income Phelps Toy Company 2002 $ 150,000 $ (16,000) 2003 240,000 (5,000) BU7300 Group Report $2 21-22 Business School 2004 756,000 72,000 2005 1,340,000 91,000 2006 2,680,000 175,000 2007 3,320,000 198,000 2008 5,580,000 248,000 2009 6,792,000 387,000 2010 5,941,000 291,000 2011 9,237,000 439,000 2012 11,622,000 566,000 2013 12,140,000 621,000 2014 17,165,000 850,000 2015 22,838,000 1,221,000 2016 27,762,000 1,437,000 2017 32,437,000 1,628,000 2018 38,911,000 1,762,000 2019 39,750,000 2,002,000 2020 39,860,000 1,950,000 For example, the 1968 rookie card of Nolan Ryan was selling for $2,000 in early 2015. The 1963 Pete Rose rookie card was valued at $500 and, finally, the first Topps card of Mickey Mantle issued in 1952 at 1 cent carried a trading value of $30,000 five decades later. While the card manufacturer did not directly participate in this price appreciation, the hope for such gains in the future keeps youngsters and adults continually active in buying cards as they come out. To convince management that the manufacturing and selling of baseball cards was a suitable activity for his firm, Mr. Barnes had to make a thorough capital budgeting analysis for the executive committee of Phelps Toy Company. The Analysis In evaluating the market potential, Mr. Barnes determined that there was no way he could firmly predict the market penetration potential for a new set of baseball cards. The sales for the set, which would be called Baseball Stars, would depend on the quality of the final product as well as the effectiveness of the promotional activities. There is also the danger of a number of errors when a set is initially issued. With approximately 750 cards in the set, there is the possibility of misquoting batting averages, misspelling names, and so on. When Fleer and Donruss introduced their new sets in 1995, they were highly criticized by collectors for the numerous errors. Mr. Barnes hoped to avoid this fate for the Baseball Stars set by making heavy expenditures on quality control. He also intended to hire a number of employees from other card companies so he would have experienced people who could identify potential problems at a very early stage. Over the years, Phelps Toy Company had developed a manual to evaluate capital budgeting projects. As a first step, Ike Barnes was required to predict anticipated sales over the next six years. While he thought this was too short a time period to evaluate the full potential of the project, he knew he had no choice but to go along with company policy. He decided to project a range for potential sales in 2016 (the first new year of business) and assign probabilities to the outcomes. The information is shown in Figure 2. Figure 2 Assumption Sales Probability Projected first-year sales Pessimistic. $1,100,000 0.25 Normal 2,000,000 0.40 Optimistic... 3,750,000 0.20 Highly optimistic....... 4,500,000 0.15 1.00 It was his intention to determine the expected value for sales for the first year and then project a 20 percent growth rate for the next three years and 10 percent for the final two years. Operating expenses, which were expected to average 70 percent of sales, would then be subtracted to determine earnings before depreciation and taxes. The primary investment to be made was in printing and production equipment, which would fall into the five-year MACRS depreciation category, as in the table below. The equipment, which represents the investment for the project, costs $2.8 million. Year MARCS depreciation rate 1 20% 32% 19.2% 11.5% 5 11.5% 6 5.8% Mr. Barnes looked into the capital budgeting manual to determine the appropriate discount rate (as shown in Figure 3). The discount rate for the project is based on the coefficient of variation of the first year's sales. One of the accounting assistants informed him that the standard deviation of first year's sales was $1,226,000. He knew he could easily determine the expected value from the data previously presented (in Figure 2). Mr. Barnes thought that it was now time to call his assistants together to do the appropriate analysis. Figure 3 Coefficient of Variation Discount Rate Discount rate determination 0-.20 8% .21-.40 10 .41-.60 14 .61-.80 16 Over .80 20 2 3 4 Required: 1. First determine the expected value of the first year's sales. 2. Then project sales for the next 5 years 3. Next determine the annual depreciation over the 6 years 4. Then combine the data into a table and calculate the cash flow for the five years. 5. To determine earnings before depreciation and taxes (EBDT), subtract projected operating expenses from projected sales. Use a tax rate of 34 percent. 6. Determine the appropriate discount rate for the firm. 7. Make a decision on whether the project is feasible, based on net present value analysis. 8. What is the drawback to using a six-year time horizon for the projectStep by Step Solution
There are 3 Steps involved in it
Step: 1

Get Instant Access to Expert-Tailored Solutions
See step-by-step solutions with expert insights and AI powered tools for academic success
Step: 2

Step: 3
Ace Your Homework with AI
Get the answers you need in no time with our AI-driven, step-by-step assistance
Get Started
The Public Private Partnership Handbook
Authors: Malcolm Morley
1st Edition
0749474262, 978-0749474263