Answered step by step
Verified Expert Solution
Link Copied!

Question

1 Approved Answer

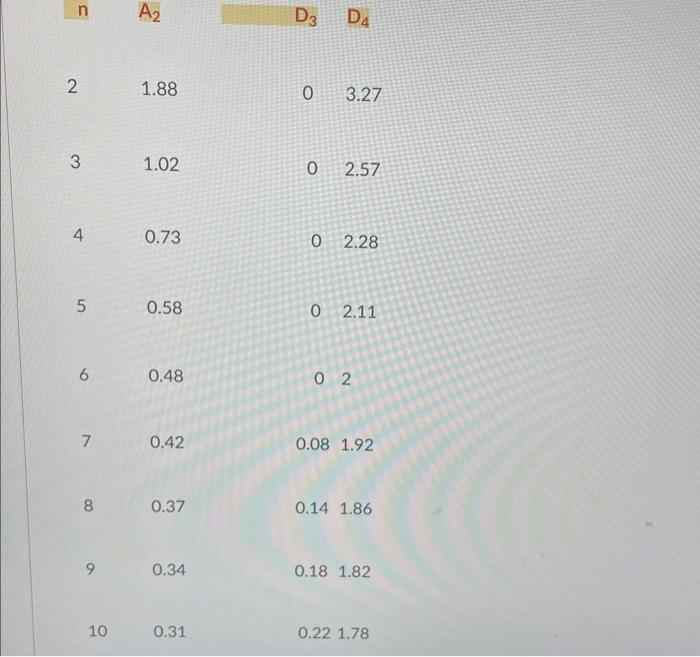
photo below is the factor fir determining control limits dor x bar and r chart Carefully examine the following table which contains weights (in oz)

photo below is the factor fir determining control limits dor x bar and r chart image text in transcribed
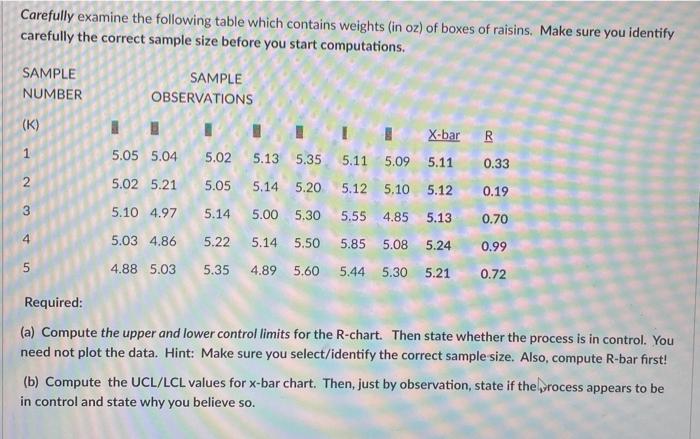
image text in transcribed
Carefully examine the following table which contains weights (in oz) of boxes of raisins. Make sure you identify carefully the correct sample size before you start computations. Required: (a) Compute the upper and lower control limits for the R-chart. Then state whether the process is in control. You need not plot the data. Hint: Make sure you select/identify the correct sample size. Also, compute R-bar first! (b) Compute the UCL/LCL values for x-bar chart. Then, just by observation, state if the, process appears to be in control and state why you believe so. 231.881.02003.272.57 450.730.58002.282.11 60.480 90.340.181.82 100.310.221.78

Step by Step Solution

There are 3 Steps involved in it

Step: 1

blur-text-image

Get Instant Access to Expert-Tailored Solutions

See step-by-step solutions with expert insights and AI powered tools for academic success

Step: 2

blur-text-image

Step: 3

blur-text-image

Ace Your Homework with AI

Get the answers you need in no time with our AI-driven, step-by-step assistance

Get Started

Recommended Textbook for

Organizational Behavior Managing People and Organizations

Authors: Ricky W. Griffin, Gregory Moorhead

11th edition

978-1305258334, 1133626696, 9781285633183, 1305258339, 1285633180, 978-1133626695

More Books

Students also viewed these General Management questions

Question

List the functions of a fulfilment house.

Answered: 1 week ago