Answered step by step
Verified Expert Solution
Link Copied!

Question

1 Approved Answer

phython test we should complete the code after txt=... import numpy as np from random import gauss import matplotlib.pyplot as plt alpha, tau =2.0,1.0 modele

phython test we should complete the code after txt=... image text in transcribed
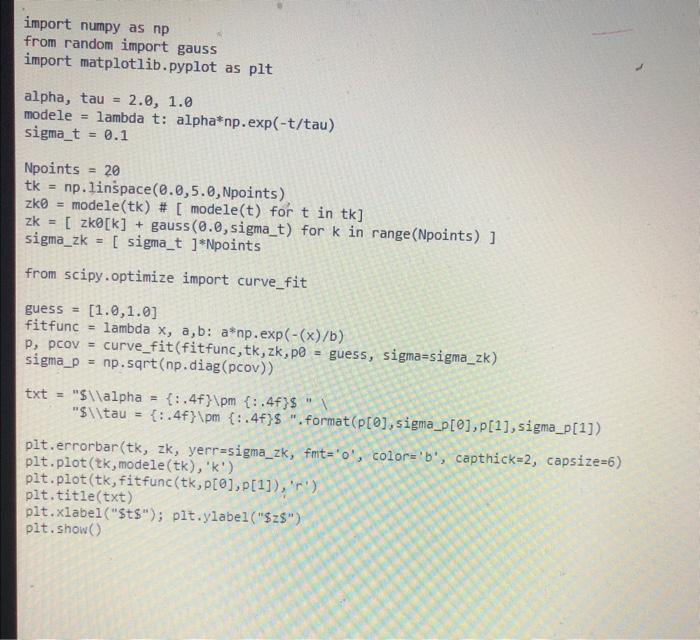
import numpy as np from random import gauss import matplotlib.pyplot as plt alpha, tau =2.0,1.0 modele = lambda t: alpha*np.exp(-t/tau) sigma_t =0.1 Npoints =20 tk=np.linspace(0.0,5.0, Npoints ) zk= modele (tk) \# modele(t) for t in tk] zk=[zk[k]+ gauss (0.0,sigma_t) for k in range(Npoints) ] sigma_zk = [ sigma_t ]*Npoints from scipy.optimize import curve_fit guess =[1.0,1.0] fitfunc = lambda x,a,b:anpexp((x)/b) p, pcov = curve_fit(fitfunc, tk, zk, pe = guess, sigma=sigma_zk) sigma_p =np. sqrt (np.diag(pcov)) plt. errorbar (tk, zk, yerr=sigma_zk, fmit=' 0 ', color=' b ', capthick=2, capsize=6) plt. plot (tk, modele(tk), ' k ') plt.plot(tk, fitfunc(tk, p[0],p[1]),r) plt.title(txt) plt.xlabel("\$t\$"); plt.ylabel("\$z\$") plt.show()

Step by Step Solution

There are 3 Steps involved in it

Step: 1

blur-text-image

Get Instant Access to Expert-Tailored Solutions

See step-by-step solutions with expert insights and AI powered tools for academic success

Step: 2

blur-text-image

Step: 3

blur-text-image

Ace Your Homework with AI

Get the answers you need in no time with our AI-driven, step-by-step assistance

Get Started

Recommended Textbook for

SQL Server Query Performance Tuning

Authors: Sajal Dam, Grant Fritchey

4th Edition

1430267429, 9781430267423

More Books

Students also viewed these Databases questions

Question

=+c. Find or create a visual.

Answered: 1 week ago