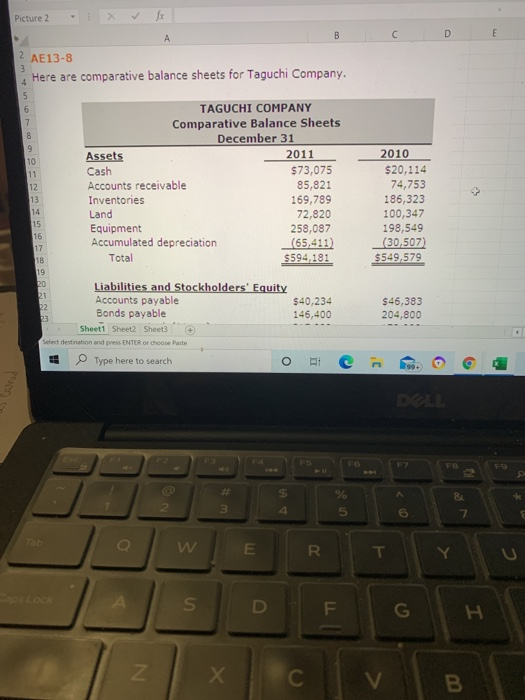
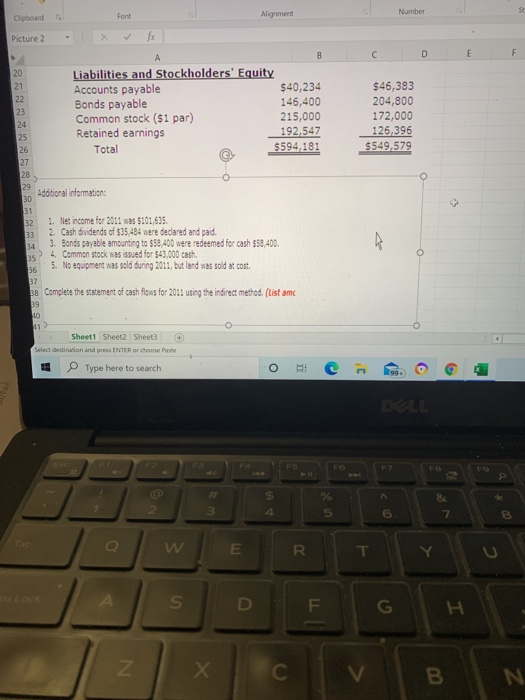
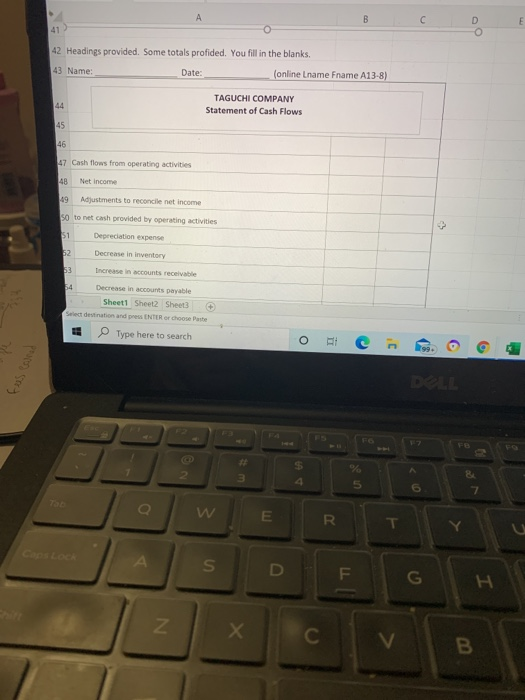
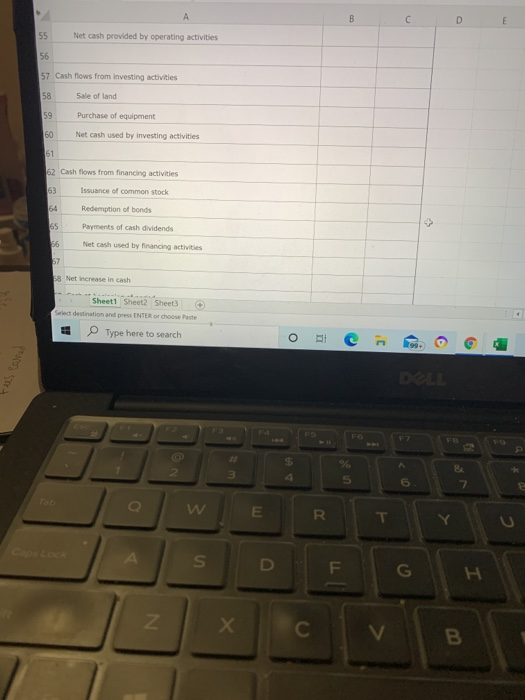
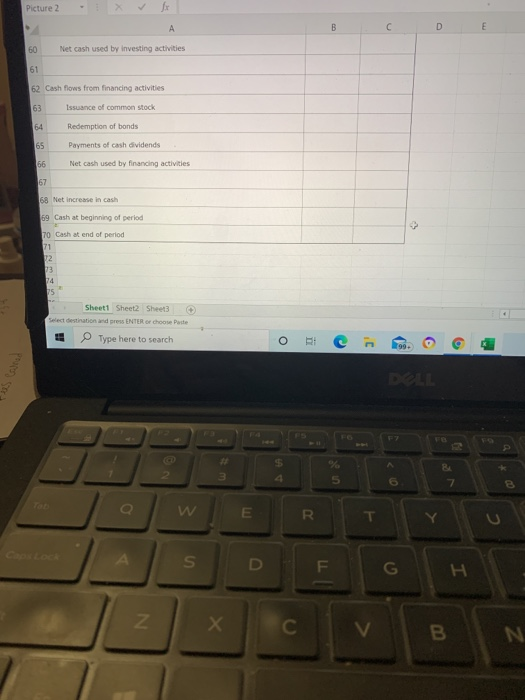
Picture 2 00 D C E 2 3 AE13-8 Here are comparative balance sheets for Taguchi Company 4 un 10 6 TAGUCHI COMPANY 7 Comparative Balance Sheets 8 December 31 9 Assets 2011 11 Cash $73,075 12 Accounts receivable 85,821 13 Inventories 169,789 14 Land 72,820 15 Equipment 258,087 16 Accumulated depreciation (65,411) 17 18 Total $594,181 19 20 Liabilities and Stockholders' Equity 21 Accounts payable $40,234 22 Bonds payable 23 146,400 Sheet1 Sheet2 Sheet3 Select destination and press ENTER or choose Paste Type here to search i 2010 $20,114 74,753 186,323 100,347 198,549 (30,507) $549,579 $46,383 204,800 4 199+ S 4 3 5 OP 7 W E R. T S D IL G I N X V . Number S Clipboard Font Alignment Picture 2 C D E F $46,383 204,800 172,000 126,396 $549,579 26 B 20 Liabilities and Stockholders' Equity 21 Accounts payable $40,234 22 Bonds payable 146,400 23 Common stock ($1 par) 215,000 24 25 Retained earnings 192,547 Total $594,181 27 28 29 Additional information: 30 31 32 1. Net income for 2011 a 5101,635 33 2. Cash dividends of $35 484 were declared and paid 34 3. Bonds payable amounting to $58,400 were redeemed for cash $58,400. 35 4. Common stock was issued for $43,000 cash. 5. No equipment was sold during 2011, but land was sold at cost. 36 37 38 Complete the statement of cash flows for 2011 using the indirect method. (List am 39 10 41 O Sheet1 Sheet2 Sheets Select destination and press ENTER or choose Paste Type here to search 4 : O TI c C 99 DLL P CN 3 4 6 7 Q E R Y S D F. I Z V B N A B C E 41 42 Headings provided. Some totals profided. You fill in the blanks. 43 Name: Date: (online Lname Frame A13-8) 44 TAGUCHI COMPANY Statement of Cash Flows 45 46 47 Cash flows from operating activities 48 Net income 49 Adjustments to reconcile net income 50 to net cash provided by operating activities + 1 Depreciation expense 62 Decrease in inventory 63 Increase in accounts receivable 94 Decrease in accounts payable Sheet1 Sheet2 Sheet Select destination and press ENTER or choose Paste 3 Type here to search OP e a DALL FB 2 3 5 7 R A s D F G . N V B B c D m 55 Net cash provided by operating activities 56 57 Cash flows from investing activities 58 Sale of land 59 Purchase of equipment 60 Net cash used by investing activities 51 62 Cash flows from financing activities 63 Issuance of common stock 64 Redemption of bonds 65 + Payments of cash dividends Net cash used by financing activities 36 57 58 Net increase in cash Sheet1 Sheet2 Sheet3 Select destination and press ENTER o choose Paste Type here to search o c J $1 tes S 4 Be 3 5 6 w E R. . A S D F. G I IN B Picture 2 B D E 60 Net cash used by investing activities 61 62 Cash flows from financing activities 63 Issuance of common stock 64 Redemption of bonds Payments of cash dividends 65 56 Net cash used by financing activities 67 68 Net increase in cash 69 Cash at beginning of period 70 Cash at end of period 71 12 13 14 75 Sheet1 Sheet2 Sheet3 Select destination and press ENTER or choose Poste Type here to search o 3 2 3 4 5 6 7 w E R - S D F G H Z V B