PICTURES ARE CLEAR! - PLEASE HELP IN FINDING THE ANSWERS
BE PART OF THE SOLUTION!
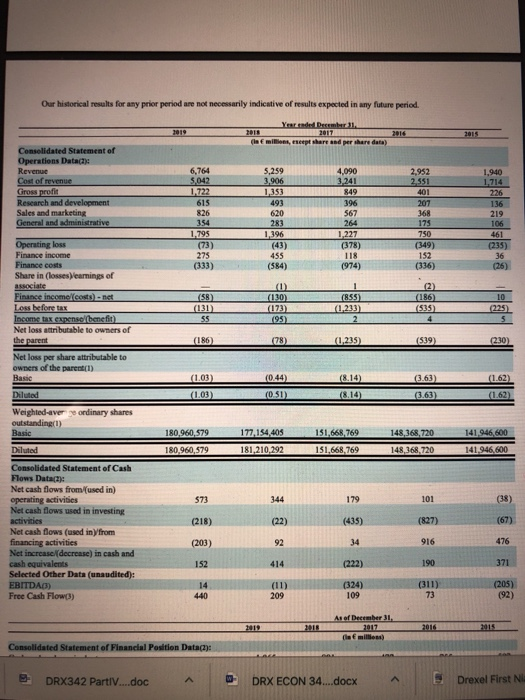
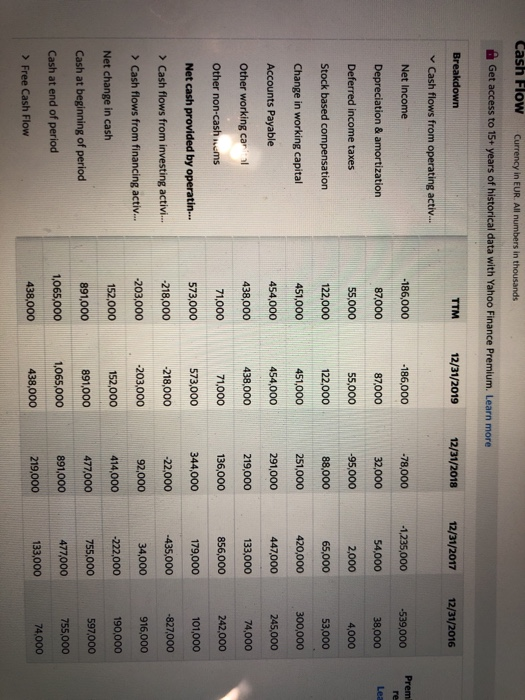
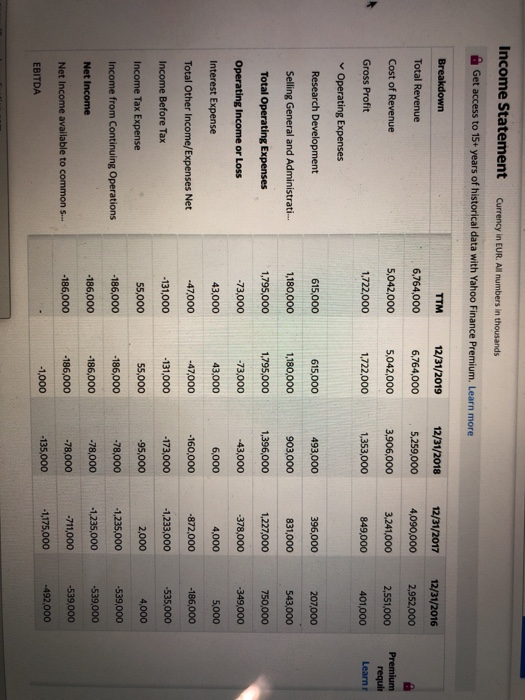
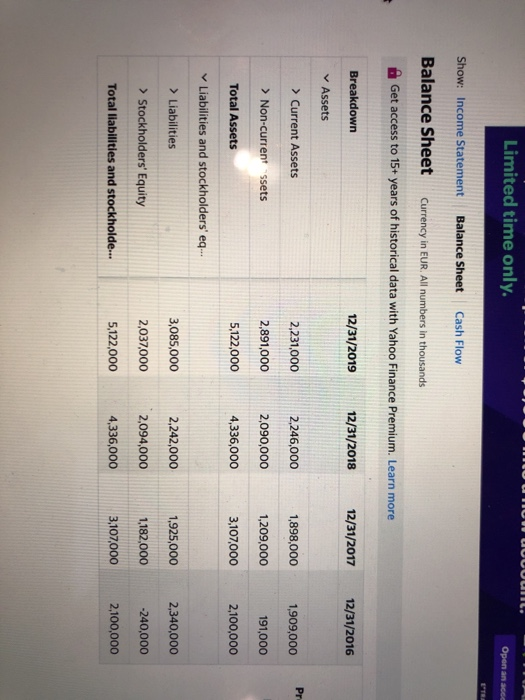
Our storical results for any prior period are not necessarily indicative of results expected in any future period Ge r ede hare data) 6,764 5,042 Co a ted Statement of Operations Datace Revenge Cost of revenue Group Research and development Sales and marketing General and administrative 5.259 3.906 1.353 1.772 4.090 3.241 849 396 826 620 567 354 203 264 (73) (378) Operating loss Finance income Finance costs Share in losses learnings of 275 455 (333) (584) 118 (974) (130) (855) (58) (131) (1,233) (173) (95) Finance Income costs) .net Losseforetak Income tax expense benefit Net loss attributable to owners of the parent Net loss per share attributable to owner of the parent (1) Basic (186) (78) (1,215) (1.03) (103) (0.44) (051) (8.14) 8.14 (363) 3.63) (1.62) (.62) Diluted Weighted averaordinary shares outstanding) Basic 1 141 946.600 180,960,579 180.960.579 177.154,405 181.210.292 51,668,769 151.668.769 148,368,720 148,368, 720 Diluted 141.946.000 101 Consolidated Statement of Cash Flows Datach: Net cash flows from (used in) operating activities Net cash flows used in investing activities Net cash flows used in from financing activities Net increase (decrease in cash and cash equivalents Selected Other Data (unaudited): FRITDAG) Free Cash Flow) SE OBI (222) (324) 109 Consolidated Statement of Financial Position Data : DRX342 Partly...doc DRX ECON 34....docx Drexel First NL Cash Flow Currency in EUR. All numbers in thousands Get access to 15+ years of historical data with Yahoo Finance Premium. Learn more Breakdown TTM 12/31/2019 12/31/2018 12/31/2017 12/31/2016 Cash flows from operating activ... Net Income -186,000 -186,000 -78,000 -1,235,000 -539,000 Prem Depreciation & amortization 87,000 32,000 38,000 Les 54,000 2,000 Deferred income taxes 55,000 4,000 87,000 55,000 122,000 451,000 -95,000 88,000 Stock based compensation 122,000 65,000 53,000 Change in working capital 451,000 251,000 420,000 300,000 Accounts Payable 454,000 454,000 447,000 245,000 291,000 219,000 Other working cara 438,000 438,000 133,000 74,000 Other non-cash.cms 71,000 71,000 136,000 856,000 242,000 Net cash provided by operatin... 573,000 573,000 344,000 179,000 101,000 -218,000 > Cash flows from investing activi... -218,000 -22,000 -435,000 -827,000 916,000 > Cash flows from financing activ... -203,000 92,000 34.000 -203,000 152,000 152,000 414,000 -222,000 Net change in cash 190,000 891,000 477,000 755,000 Cash at beginning of period 597,000 891,000 1,065,000 438,000 1,065,000 891,000 755,000 Cash at end of period 477,000 219,000 438,000 74,000 133,000 > Free Cash Flow Income Statement Currency in EUR. All numbers in thousands Get access to 15+ years of historical data with Yahoo Finance Premium. Learn more Breakdown 12/31/2017 12/31/2016 12/31/2018 5,259,000 Total Revenue 12/31/2019 6,764,000 5,042,000 4,090,000 TTM 6,764,000 5,042,000 1,722,000 2,952,000 Cost of Revenue 3,906,000 3,241,000 2,551,000 401,000 Premium requin Learn Gross Profit 1,722,000 1,353,000 849,000 Operating Expenses Research Development 615,000 615,000 493,000 396,000 207,000 Selling General and Administrati... 1,180,000 543,000 831,000 1,227,000 Total Operating Expenses 1,795,000 903,000 1,396,000 -43,000 750,000 1,180,000 1,795,000 -73,000 43,000 - 47,000 Operating Income or Loss -73,000 -378,000 Interest Expense 4,000 43,000 -47,000 -131,000 6,000 -160,000 -349,000 5,000 -186,000 Total Other Income/Expenses Net -872,000 Income Before Tax -131,000 -535,000 -173,000 -95,000 Income Tax Expense 55,000 55,000 -1,233,000 2,000 -1,235,000 -1,235,000 Income from Continuing Operations -186,000 -186,000 -78,000 -186,000 Net Income -186,000 4,000 -539,000 -539,000 -539,000 -492.000 -78,000 -186,000 -78,000 -186,000 Net Income available to common S... -711,000 -1,000 EBITDA -1,175,000 -135,000 Limited time only. Open an acce Show: Income Statement Balance Sheet Cash Flow Balance Sheet Currency in EUR. All numbers in thousands Get access to 15+ years of historical data with Yahoo Finance Premium. Learn more Breakdown 12/31/2019 12/31/2018 12/31/2017 12/31/2016 Assets > Current Assets 2,231,000 2,246,000 1,898,000 1909,000 Pr > Non-current ssets 2,891,000 2,090,000 1,209,000 191,000 Total Assets 5,122,000 4,336,000 3,107,000 2,100,000 Liabilities and stockholders' eq... > Liabilities 3,085,000 2,242,000 1,925,000 2,340,000 > Stockholders' Equity 2,037,000 2,094,000 1,182,000 -240,000 Total liabilities and stockholde... 5,122,000 4,336,000 3,107,000 2,100,000 With the information provided below please make Excel document that shows FUTURE CASH FLOW TO FIRM & FREE CASH FLOW TO FIRM Focus E EE - 2524 words & English (United States) MAR Our storical results for any prior period are not necessarily indicative of results expected in any future period Ge r ede hare data) 6,764 5,042 Co a ted Statement of Operations Datace Revenge Cost of revenue Group Research and development Sales and marketing General and administrative 5.259 3.906 1.353 1.772 4.090 3.241 849 396 826 620 567 354 203 264 (73) (378) Operating loss Finance income Finance costs Share in losses learnings of 275 455 (333) (584) 118 (974) (130) (855) (58) (131) (1,233) (173) (95) Finance Income costs) .net Losseforetak Income tax expense benefit Net loss attributable to owners of the parent Net loss per share attributable to owner of the parent (1) Basic (186) (78) (1,215) (1.03) (103) (0.44) (051) (8.14) 8.14 (363) 3.63) (1.62) (.62) Diluted Weighted averaordinary shares outstanding) Basic 1 141 946.600 180,960,579 180.960.579 177.154,405 181.210.292 51,668,769 151.668.769 148,368,720 148,368, 720 Diluted 141.946.000 101 Consolidated Statement of Cash Flows Datach: Net cash flows from (used in) operating activities Net cash flows used in investing activities Net cash flows used in from financing activities Net increase (decrease in cash and cash equivalents Selected Other Data (unaudited): FRITDAG) Free Cash Flow) SE OBI (222) (324) 109 Consolidated Statement of Financial Position Data : DRX342 Partly...doc DRX ECON 34....docx Drexel First NL Cash Flow Currency in EUR. All numbers in thousands Get access to 15+ years of historical data with Yahoo Finance Premium. Learn more Breakdown TTM 12/31/2019 12/31/2018 12/31/2017 12/31/2016 Cash flows from operating activ... Net Income -186,000 -186,000 -78,000 -1,235,000 -539,000 Prem Depreciation & amortization 87,000 32,000 38,000 Les 54,000 2,000 Deferred income taxes 55,000 4,000 87,000 55,000 122,000 451,000 -95,000 88,000 Stock based compensation 122,000 65,000 53,000 Change in working capital 451,000 251,000 420,000 300,000 Accounts Payable 454,000 454,000 447,000 245,000 291,000 219,000 Other working cara 438,000 438,000 133,000 74,000 Other non-cash.cms 71,000 71,000 136,000 856,000 242,000 Net cash provided by operatin... 573,000 573,000 344,000 179,000 101,000 -218,000 > Cash flows from investing activi... -218,000 -22,000 -435,000 -827,000 916,000 > Cash flows from financing activ... -203,000 92,000 34.000 -203,000 152,000 152,000 414,000 -222,000 Net change in cash 190,000 891,000 477,000 755,000 Cash at beginning of period 597,000 891,000 1,065,000 438,000 1,065,000 891,000 755,000 Cash at end of period 477,000 219,000 438,000 74,000 133,000 > Free Cash Flow Income Statement Currency in EUR. All numbers in thousands Get access to 15+ years of historical data with Yahoo Finance Premium. Learn more Breakdown 12/31/2017 12/31/2016 12/31/2018 5,259,000 Total Revenue 12/31/2019 6,764,000 5,042,000 4,090,000 TTM 6,764,000 5,042,000 1,722,000 2,952,000 Cost of Revenue 3,906,000 3,241,000 2,551,000 401,000 Premium requin Learn Gross Profit 1,722,000 1,353,000 849,000 Operating Expenses Research Development 615,000 615,000 493,000 396,000 207,000 Selling General and Administrati... 1,180,000 543,000 831,000 1,227,000 Total Operating Expenses 1,795,000 903,000 1,396,000 -43,000 750,000 1,180,000 1,795,000 -73,000 43,000 - 47,000 Operating Income or Loss -73,000 -378,000 Interest Expense 4,000 43,000 -47,000 -131,000 6,000 -160,000 -349,000 5,000 -186,000 Total Other Income/Expenses Net -872,000 Income Before Tax -131,000 -535,000 -173,000 -95,000 Income Tax Expense 55,000 55,000 -1,233,000 2,000 -1,235,000 -1,235,000 Income from Continuing Operations -186,000 -186,000 -78,000 -186,000 Net Income -186,000 4,000 -539,000 -539,000 -539,000 -492.000 -78,000 -186,000 -78,000 -186,000 Net Income available to common S... -711,000 -1,000 EBITDA -1,175,000 -135,000 Limited time only. Open an acce Show: Income Statement Balance Sheet Cash Flow Balance Sheet Currency in EUR. All numbers in thousands Get access to 15+ years of historical data with Yahoo Finance Premium. Learn more Breakdown 12/31/2019 12/31/2018 12/31/2017 12/31/2016 Assets > Current Assets 2,231,000 2,246,000 1,898,000 1909,000 Pr > Non-current ssets 2,891,000 2,090,000 1,209,000 191,000 Total Assets 5,122,000 4,336,000 3,107,000 2,100,000 Liabilities and stockholders' eq... > Liabilities 3,085,000 2,242,000 1,925,000 2,340,000 > Stockholders' Equity 2,037,000 2,094,000 1,182,000 -240,000 Total liabilities and stockholde... 5,122,000 4,336,000 3,107,000 2,100,000 With the information provided below please make Excel document that shows FUTURE CASH FLOW TO FIRM & FREE CASH FLOW TO FIRM Focus E EE - 2524 words & English (United States) MAR