Answered step by step
Verified Expert Solution
Question
1 Approved Answer
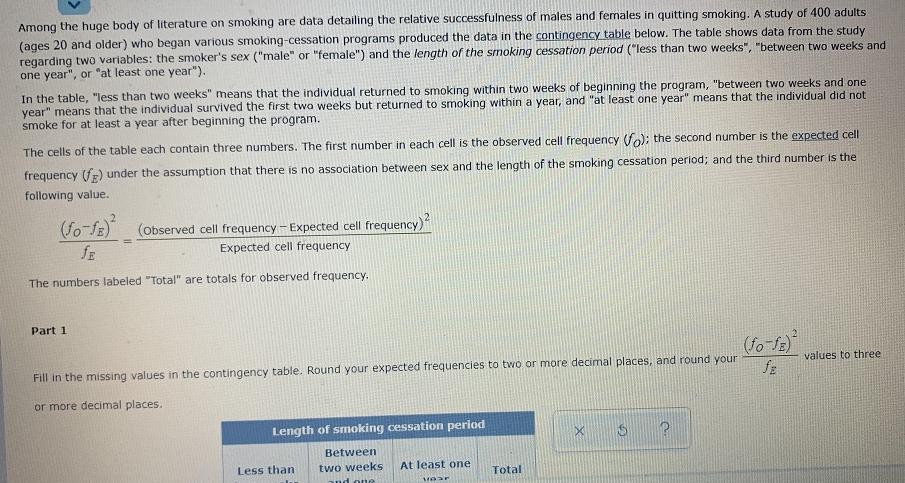
Among the huge body of literature on smoking are data detailing the relative successfulness of males and females in quitting smoking. A study of


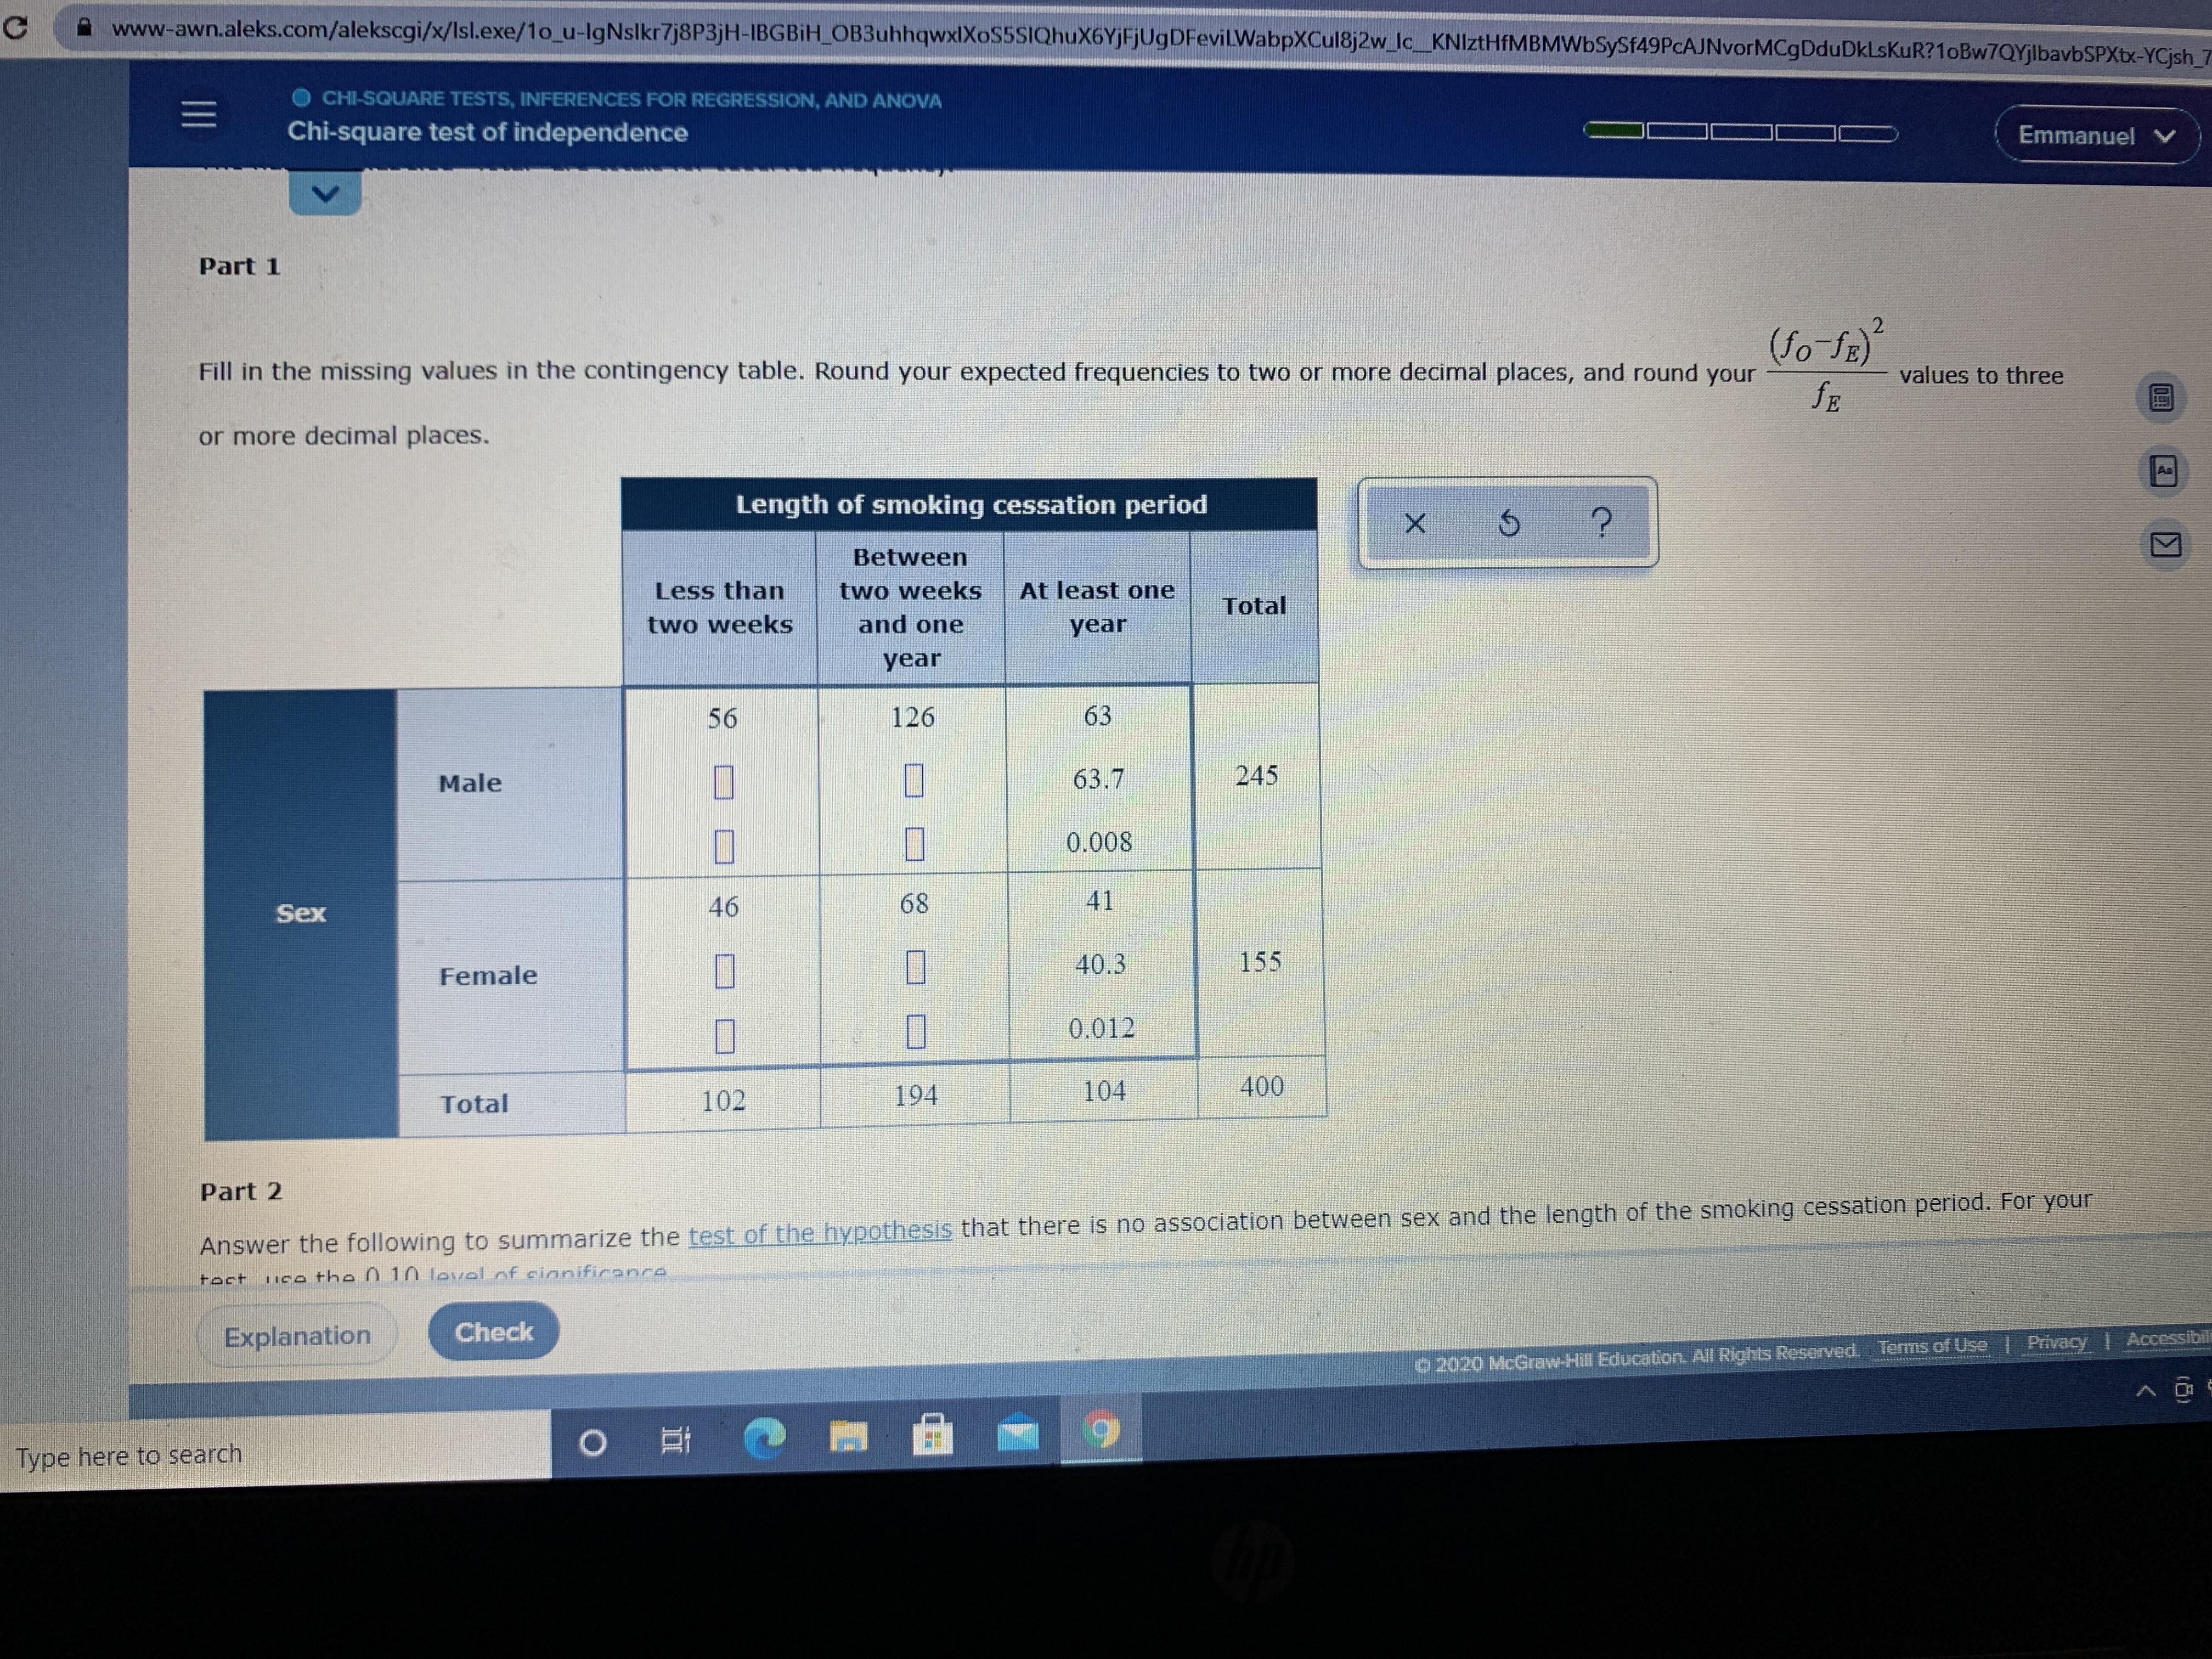
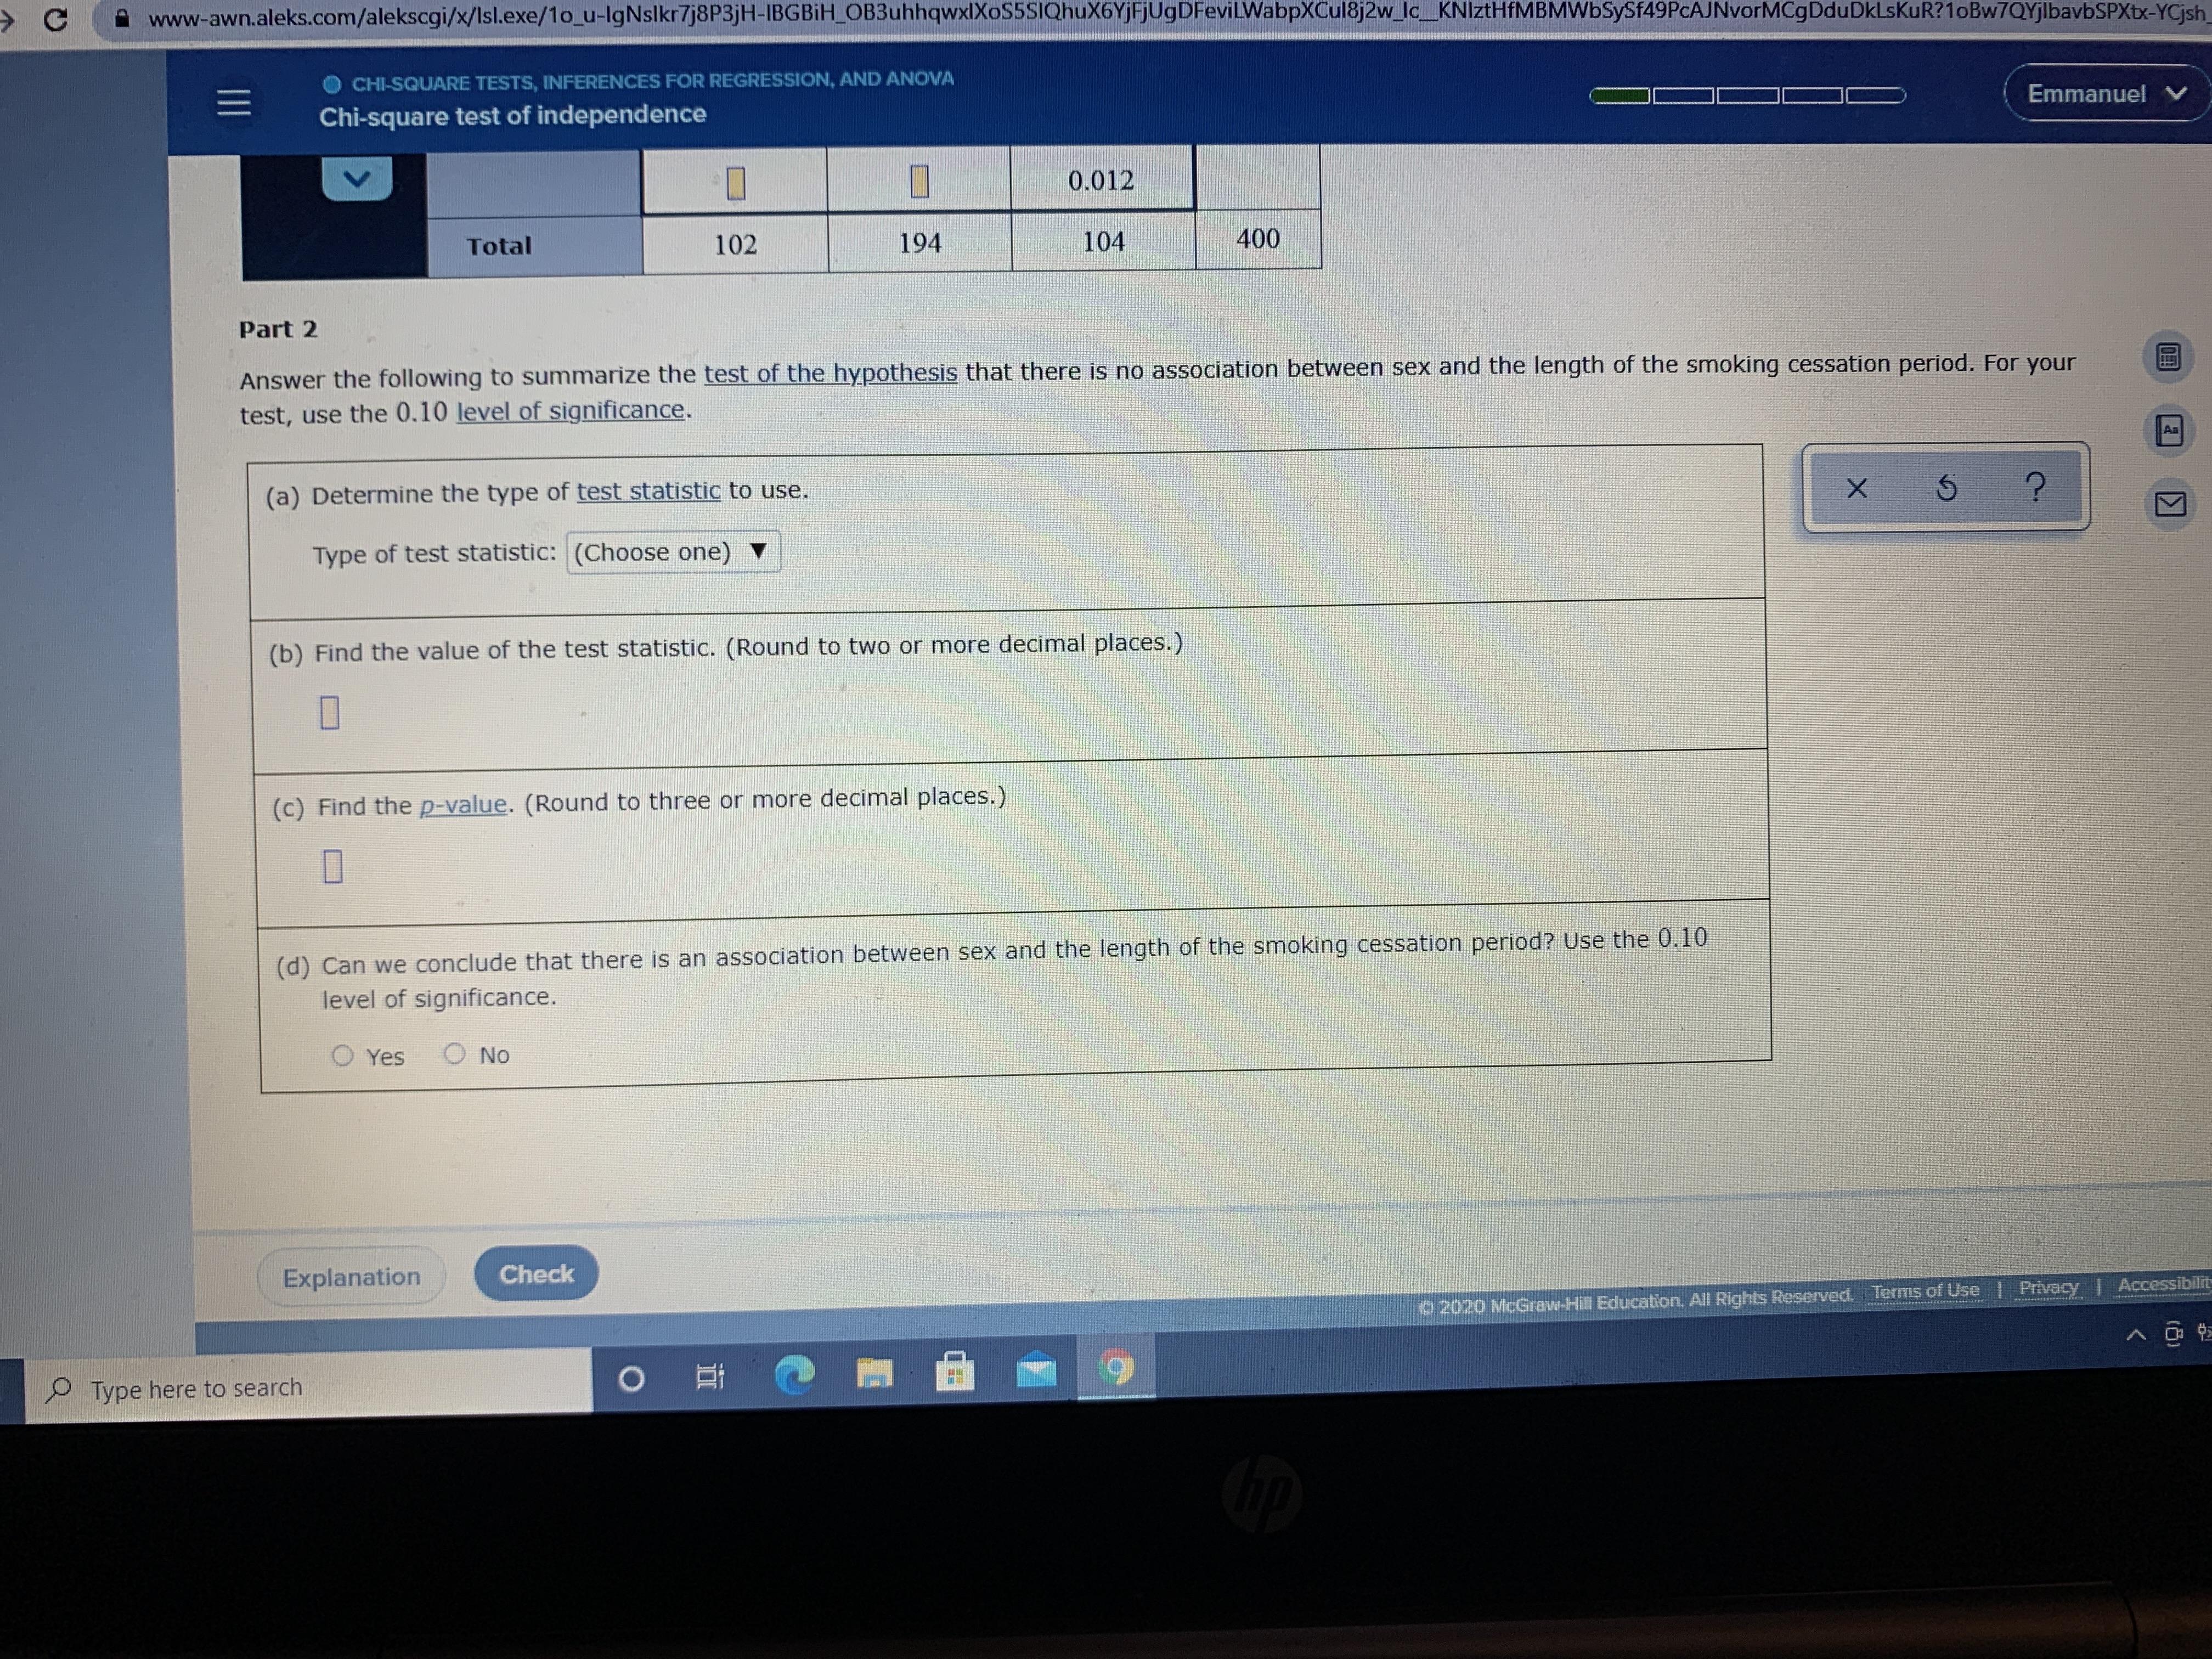
Among the huge body of literature on smoking are data detailing the relative successfulness of males and females in quitting smoking. A study of 400 adults (ages 20 and older) who began various smoking-cessation programs produced the data in the contingency table below. The table shows data from the study regarding two variables: the smoker's sex ("male" or "female") and the length of the smoking cessation period ("less than two weeks", "between two weeks and one year", or "at least one year"). In the table, "less than two weeks" means that the individual returned to smoking within two weeks of beginning the program, "between two weeks and one year" means that the individual survived the first two weeks but returned to smoking within a year, and "at least one year" means that the individual did not smoke for at least a year after beginning the program. The cells of the table each contain three numbers. The first number in each cell is the observed cell frequency (o); the second number is the expected cell frequency (f) under the assumption that there is no association between sex and the length of the smoking cessation period; and the third number is the following value. (fo-fe) (observed cell frequency - Expected cell frequency)2 E Expected cell frequency The numbers labeled "Total" are totals for observed frequency. Part 1 (fo-fE) Fill in the missing values in the contingency table. Round your expected frequencies to two or more decimal places, and round your values to three or more decimal places. Length of smoking cessation period X ? Between two weeks one At least one VOSK Less than Total C www-awn.aleks.com/alekscgi/x/Isl.exe/10_u-IgNslkr7j8P3jH-IBGBiH_OB3uhhqwxIXOS5SIQhuX6YjFjUgDFeviLWabpXCul8j2w_lc_KNIztHfMBMWbSySf49PcAJNvorMCgDduDkLsKuR?10Bw7QYjlbavbSPXtx-YCjsh_7 O CHI-SQUARE TESTS, INFERENCES FOR REGRESSION, AND ANOVA = Chi-square test of independence Emmanuel v Part 1 2 (fo-fg) Fill in the missing values in the contingency table. Round your expected frequencies to two or more decimal places, and round your values to three E or more decimal places. Length of smoking cessation period ? Less than two weeks Between two weeks and one year At least one year Total 56 126 63 Male 7 63.7 245 0 0 0.008 46 68 41 0 40.3 1 155 Female 0 0.012 194 104 400 102 Total Part 2 Answer the following to summarize the test of the hypothesis that there is no association between sex and the length of the smoking cessation period. For your tact uce the 10 level of cinnificance Explanation Check 2020 McGraw-Hill Education. All Rights Reserved. Terms of Use | Privacy | Accessibil O E Chp Type here to search Sex C www-awn.aleks.com/alekscgi/x/lsl.exe/10_u-IgNslkr7j8P3jH-IBGBIH OB3uhhqwxIXOS5SIQhuX6YjFjUgDFeviLWabpXCul8j2w_lc_KNIztHfMBMWbSySf49PCAJNvorMCgDduDkLsKuR? 1oBw7QYjlbavbSPXtx-YCjsh = CHI-SQUARE TESTS, INFERENCES FOR REGRESSION, AND ANOVA Chi-square test of independence Emmanuel V 0 0 0.012 Total 102 194 104 400 Part 2 Answer the following to summarize the test of the hypothesis that there is no association between sex and the length of the smoking cessation period. For your test, use the 0.10 level of significance. (a) Determine the type of test statistic to use. X 5 ? Type of test statistic: (Choose one) (b) Find the value of the test statistic. (Round to two or more decimal places.) 0 (c) Find the p-value. (Round to three or more decimal places.) 0 (d) Can we conclude that there is an association between sex and the length of the smoking cessation period? Use the 0.10 level of significance. O Yes No Explanation Type here to search Check O Et hp 2020 McGraw-Hill Education. All Rights Reserved. Terms of Use | Privacy | Accessibilit ^>
Step by Step Solution
★★★★★
3.43 Rating (159 Votes )
There are 3 Steps involved in it
Step: 1

Get Instant Access to Expert-Tailored Solutions
See step-by-step solutions with expert insights and AI powered tools for academic success
Step: 2

Step: 3

Ace Your Homework with AI
Get the answers you need in no time with our AI-driven, step-by-step assistance
Get Started


