

Answered step by step
Verified Expert Solution
Question
1 Approved Answer
please an expert called jammer solved this question but when i used the mathlad codes he posted, i kept getting error in line 7 which
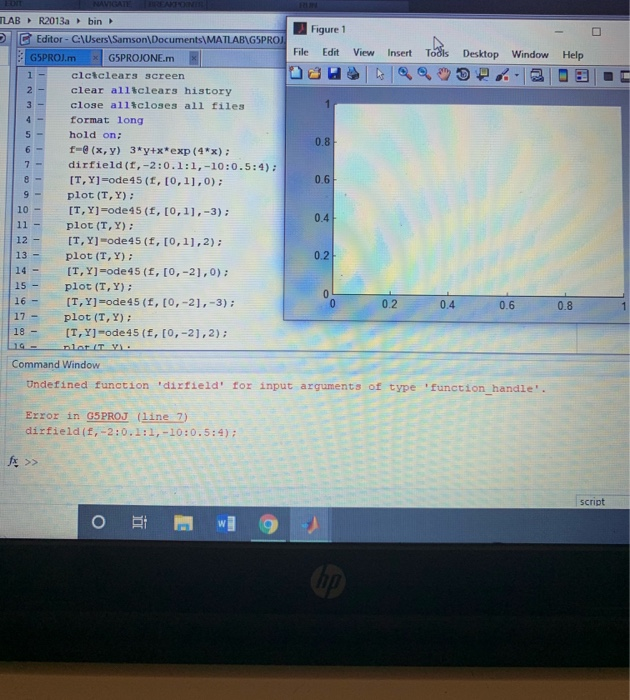
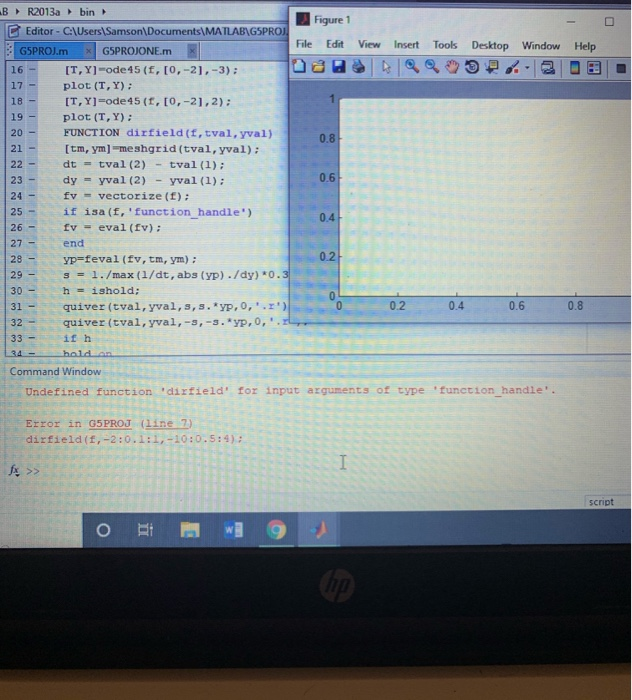
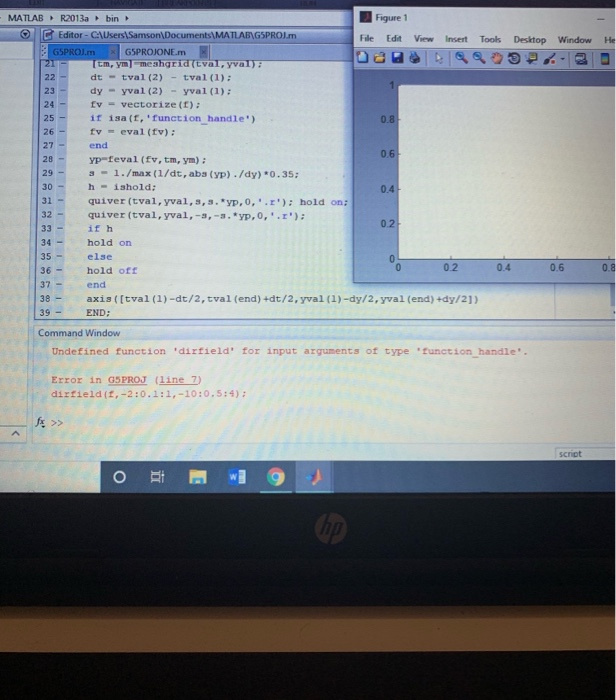
please an expert called jammer solved this question but when i used the mathlad codes he posted, i kept getting error in line 7 which i don't understand and also the figure i'm getting is not showing any plotting of direction. please help out or solve it again. jammer solution and the question is posted below even though he used the solution figure to cover his own mathlab codes. thanks. 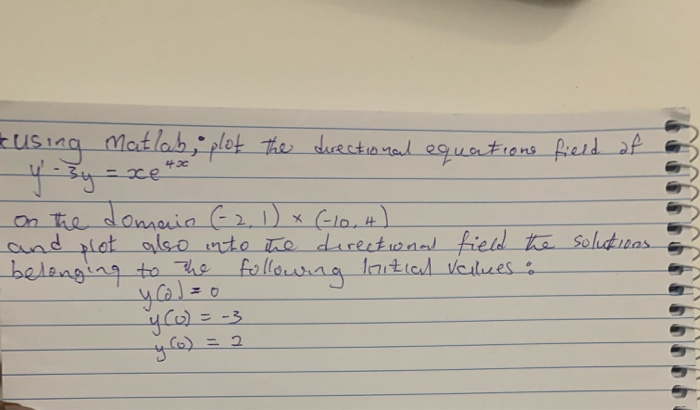
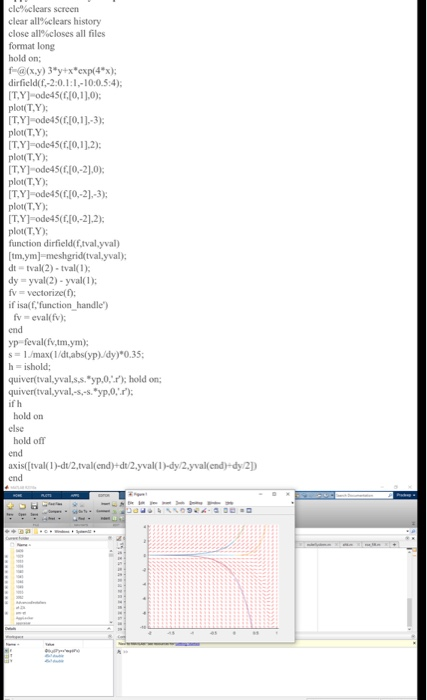
O - Help Insert Todis Desktop Window co LABR2013a bin Figure 1 IC Editor - C:\Users\Samson\Documents\MATLAB\GSPROJ GSPROJ. GSPROJONE. m x File Edit View clctclears screen clear alltclears history close alltcloses all files format long hold on; 0.8 -@(X,Y) 3*y+x*exp(4*); dirfield(1,-2:0.1:1, -10:0.5:1); [T,Y]=ode 45 (f, [0,1], 0); 0.6 plot (T, Y): [T, Y)-ode 45 (f, [0,1),-3); plot (T,Y): [T,Y) Mode 45(f, [0,1],2); plot (T,Y); [T, Y)-ode 45 (f, [0,-2), 0); plot (T, Y); [T,Y]=ode 45 (E, [0,-2),-3); - plot (T,Y): [T,Y)-ode 45 (E, [0,-2),2); plat UTY. Command Window Undefined function 'dirfield' for input arguments 0.41 0.2 02 04 0.6 type "function hand Error in GSPROJ (line) dirfield(f, -2:0.1:1,-10:0. fx >> script B Figure 1 File Edit View Insert Tools Desktop Window Help R2013a bin Editor - C:\Users\Samson\Documents\MATLAB\GSPROJ. GSPROJ. GSPROJONE. m x [T,Y]-ode 45(, [0,-2),-3); plot (T,Y): [T,Y]=ode 45 (1, [0,-2), 2): plot (T,Y): FUNCTION dirfield (f, tval, [tm, ym) -meshgrid (tval, yval); dt = tval (2) - tval(1); dy = yval (2) - yval (1): fv = vectorize (f); if isa (f, 'function handle fv = eval(fv); end yp=feval (fv, tm, ym); s - 1./max (1/dt, abs (yp). /dy) *0.3 h = ishold; 31 - quiver (tval, yval, s, s. *YP,0,'.r') 32- quiver (tval, yval,-3,-3. YP,0,'.PL 33 - if h 11111111111 - 0.2 0.4 0.6 0.8 Command Window Undefined function 'di nts of type 'function handle'. Error in G5 PROJ (lin dirfield(f, -2:0.1 Script o Biwi 9 Window He 0.6 - MATLABR2013abin Figure 1 C Editor - C:\Users\Samson\Documents\MATLAB\GSPROJ. File Edit View Insert Tools Desktop GSPROJ. GSPROJONE.m [tm, ym] meahgrid (tval, yval): dt - tval (2) - tval (1): dy - yval (2) - yval (1): fv = vectorize (1): if isa(, 'function handle') 0.8 fv = eval(fv); end yp-feval(fv, tm, ym); 3 - 1./max (1/dt, abs (yp). /dy) *0.35; h - ishold; 0.4 quiver (tval, yval, 3, 3. *YP,0,'.r'): hold on: quiver (tval, yval,-3,-3. YP,0,'.r'); 02 ifh hold on else hold off 0 02 0.4 end 38 - axis ([tval(1)-dt/2, tval (end)+dt/2, yval (1)-dy/2, yval (end) +dy/2]) END; 0.6 0.8 37 - Command Window Undefined function 'dirfield' for input arguments of type 'function handler. Error in GSPROJ (line 7) dirfield (1, -2:0.1:1,-10:0.5:9); script wg 9 * using matlab, plot the directional equations field of On the domain (-2, 1) x (10,4) and plot also into the directional field the belonging to the following initial values : solutions y (o)=-3 cleclears screen clear all%clears history close all%closes all files format long hold on f (x,y) 3"yex*exp(4x) dirfield(1.-2:0.1:1,-10:05:4). [TY)-od 45({ [0.13.0); plot(TY): [T.Y] ode45(C[0.11-3) plot(.Y): T.Y] ode45(r.[0.11.2): plot(TY: [T.Y)-odo45(10-23,0): plot(TY): IT.Y)-odo ( [0,-2).-3): plot(TY): IT.Y) ode45(C10-2] 2): plot(T.Y): function dirfield (f.tvalyval) [im.ym)-meshgridtvalyval), dttval(2) - tval(1): dy-yval(2) - yval(1): fy vectorize(t): if isa'function handle') fv eval(fv): end yp feval(fv.tm.ym): $ 1./max(1/diabs(yp)/dy)'0.35: h ishold; quiver(val.yval.s.s.yp.0,1./'), hold on: quivertval.yval.-5.-5. Typ0,1"); ifh hold on else hold off end axis[tval(1)-du2tval(end)-du2 yval(1)-dy/2yval(end)-dy/2 end Step by Step Solution
There are 3 Steps involved in it
Step: 1

Get Instant Access to Expert-Tailored Solutions
See step-by-step solutions with expert insights and AI powered tools for academic success
Step: 2

Step: 3
Ace Your Homework with AI
Get the answers you need in no time with our AI-driven, step-by-step assistance
Get Started
Database Systems Design Implementation And Management
Authors: Carlos Coronel, Steven Morris
14th Edition
978-0357673034