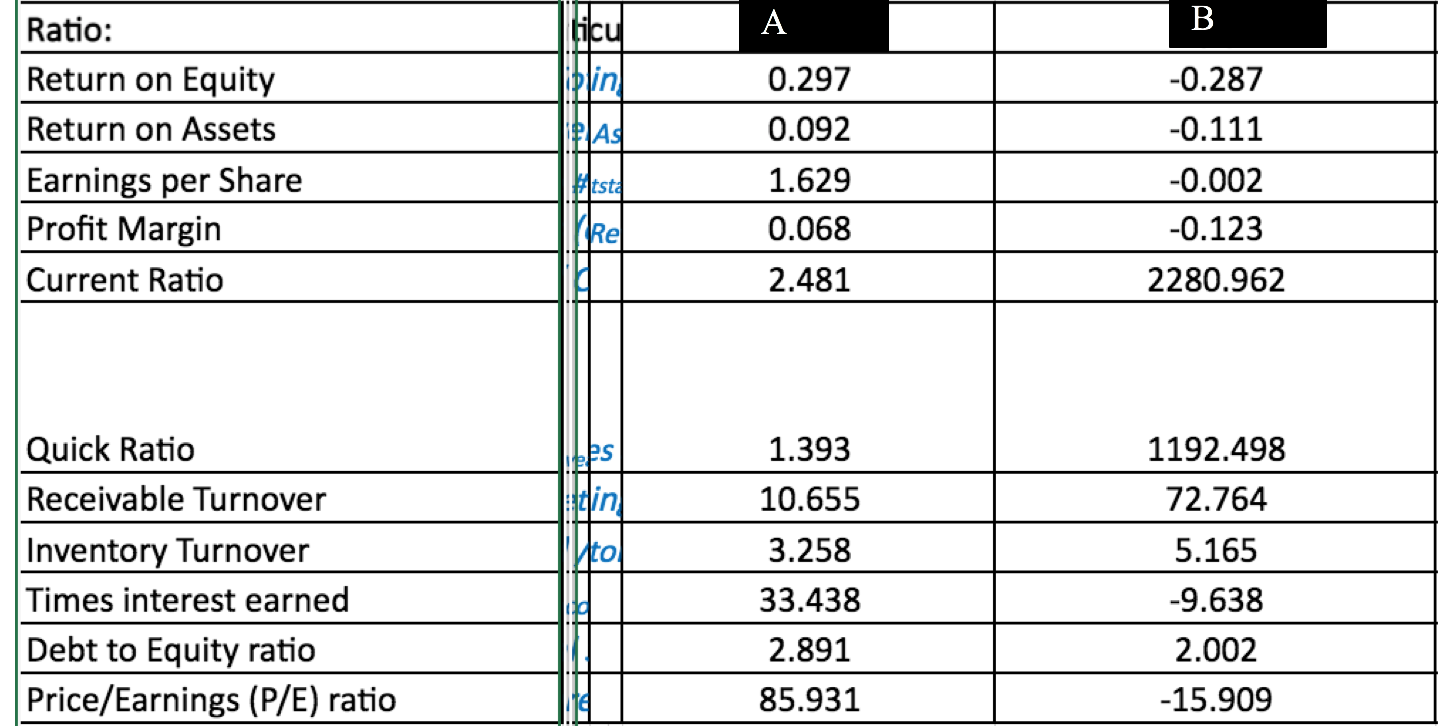
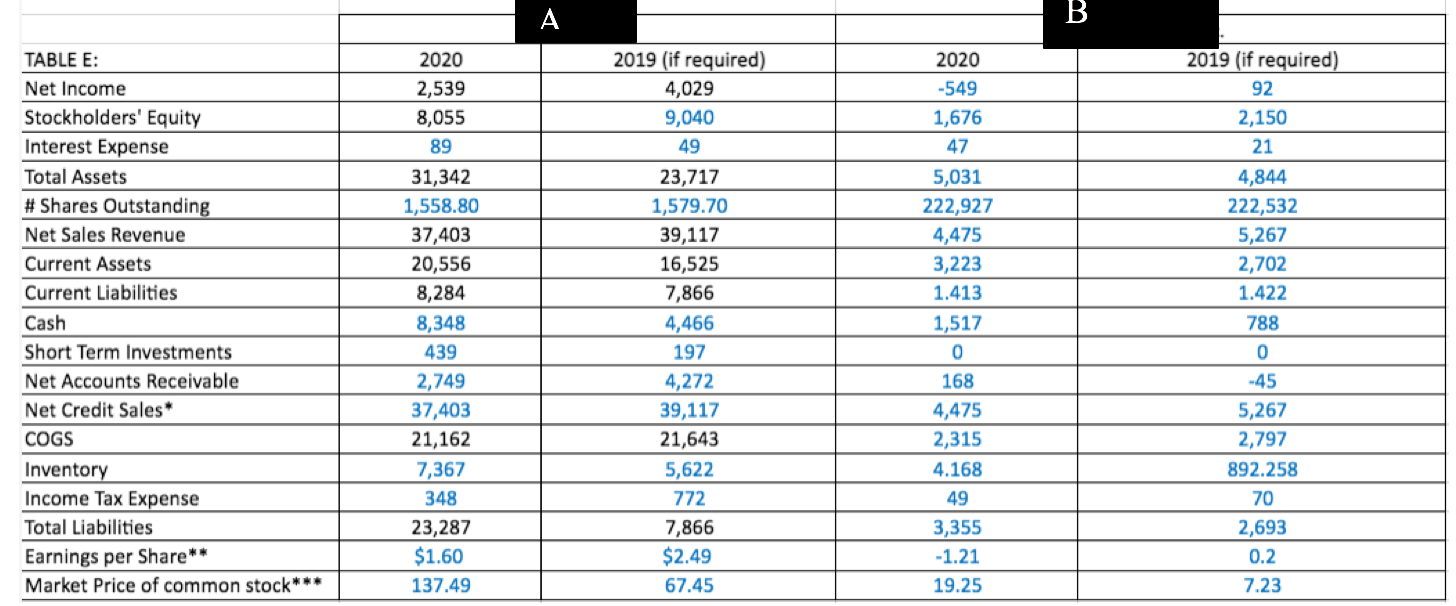
Please analyze the company in terms of its solvency and market ratio to provide your investment and credit recommendation. Use the results of your ratio and other analyses on Excel sheet to support your answers: state what each ratio tells us in general (but no need to define the ratio), summarize how your company is performing in these categories, and then analyze your companys performance also compared company A to its competitor company B.
Select at least two ratios from each category:
1. Solvency (e.g. debt to equity ratio)
2. Market ratios (e.g. EPS)


B A hicu plin -0.287 0.297 0.092 PAS Ratio: Return on Equity Return on Assets Earnings per Share Profit Margin Current Ratio #tstd Rel 1.629 0.068 -0.111 -0.002 -0.123 2.481 2280.962 es 1.393 10.655 1192.498 72.764 Quick Ratio Receivable Turnover Inventory Turnover Times interest earned Debt to Equity ratio Price/Earnings (P/E) ratio din Fol 5.165 -9.638 3.258 33.438 2.891 85.931 2.002 -15.909 A B 2020 TABLE E: Net Income Stockholders' Equity Interest Expense Total Assets # Shares Outstanding Net Sales Revenue Current Assets Current Liabilities Cash Short Term Investments Net Accounts Receivable Net Credit Sales* COGS Inventory Income Tax Expense Total Liabilities Earnings per Share** Market Price of common stock*** 2020 2,539 8,055 89 31,342 1,558.80 37,403 20,556 8,284 8,348 439 2,749 37,403 21,162 7,367 348 23,287 $1.60 137.49 2019 (if required) 4,029 9,040 49 23,717 1,579.70 39,117 16,525 7,866 4,466 197 4,272 39,117 21,643 5,622 772 7,866 $2.49 67.45 -549 1,676 47 5,031 222,927 4,475 3,223 1.413 1,517 0 2019 (if required) 92 2,150 21 4,844 222,532 5,267 2,702 1.422 788 0 -45 5,267 2,797 892.258 70 2,693 0.2 7.23 168 4,475 2,315 4.168 49 3,355 -1.21 19.25 B A hicu plin -0.287 0.297 0.092 PAS Ratio: Return on Equity Return on Assets Earnings per Share Profit Margin Current Ratio #tstd Rel 1.629 0.068 -0.111 -0.002 -0.123 2.481 2280.962 es 1.393 10.655 1192.498 72.764 Quick Ratio Receivable Turnover Inventory Turnover Times interest earned Debt to Equity ratio Price/Earnings (P/E) ratio din Fol 5.165 -9.638 3.258 33.438 2.891 85.931 2.002 -15.909 A B 2020 TABLE E: Net Income Stockholders' Equity Interest Expense Total Assets # Shares Outstanding Net Sales Revenue Current Assets Current Liabilities Cash Short Term Investments Net Accounts Receivable Net Credit Sales* COGS Inventory Income Tax Expense Total Liabilities Earnings per Share** Market Price of common stock*** 2020 2,539 8,055 89 31,342 1,558.80 37,403 20,556 8,284 8,348 439 2,749 37,403 21,162 7,367 348 23,287 $1.60 137.49 2019 (if required) 4,029 9,040 49 23,717 1,579.70 39,117 16,525 7,866 4,466 197 4,272 39,117 21,643 5,622 772 7,866 $2.49 67.45 -549 1,676 47 5,031 222,927 4,475 3,223 1.413 1,517 0 2019 (if required) 92 2,150 21 4,844 222,532 5,267 2,702 1.422 788 0 -45 5,267 2,797 892.258 70 2,693 0.2 7.23 168 4,475 2,315 4.168 49 3,355 -1.21 19.25


