Please answer all parts of each question, show work and provide detailed steps. Thanks in advance!
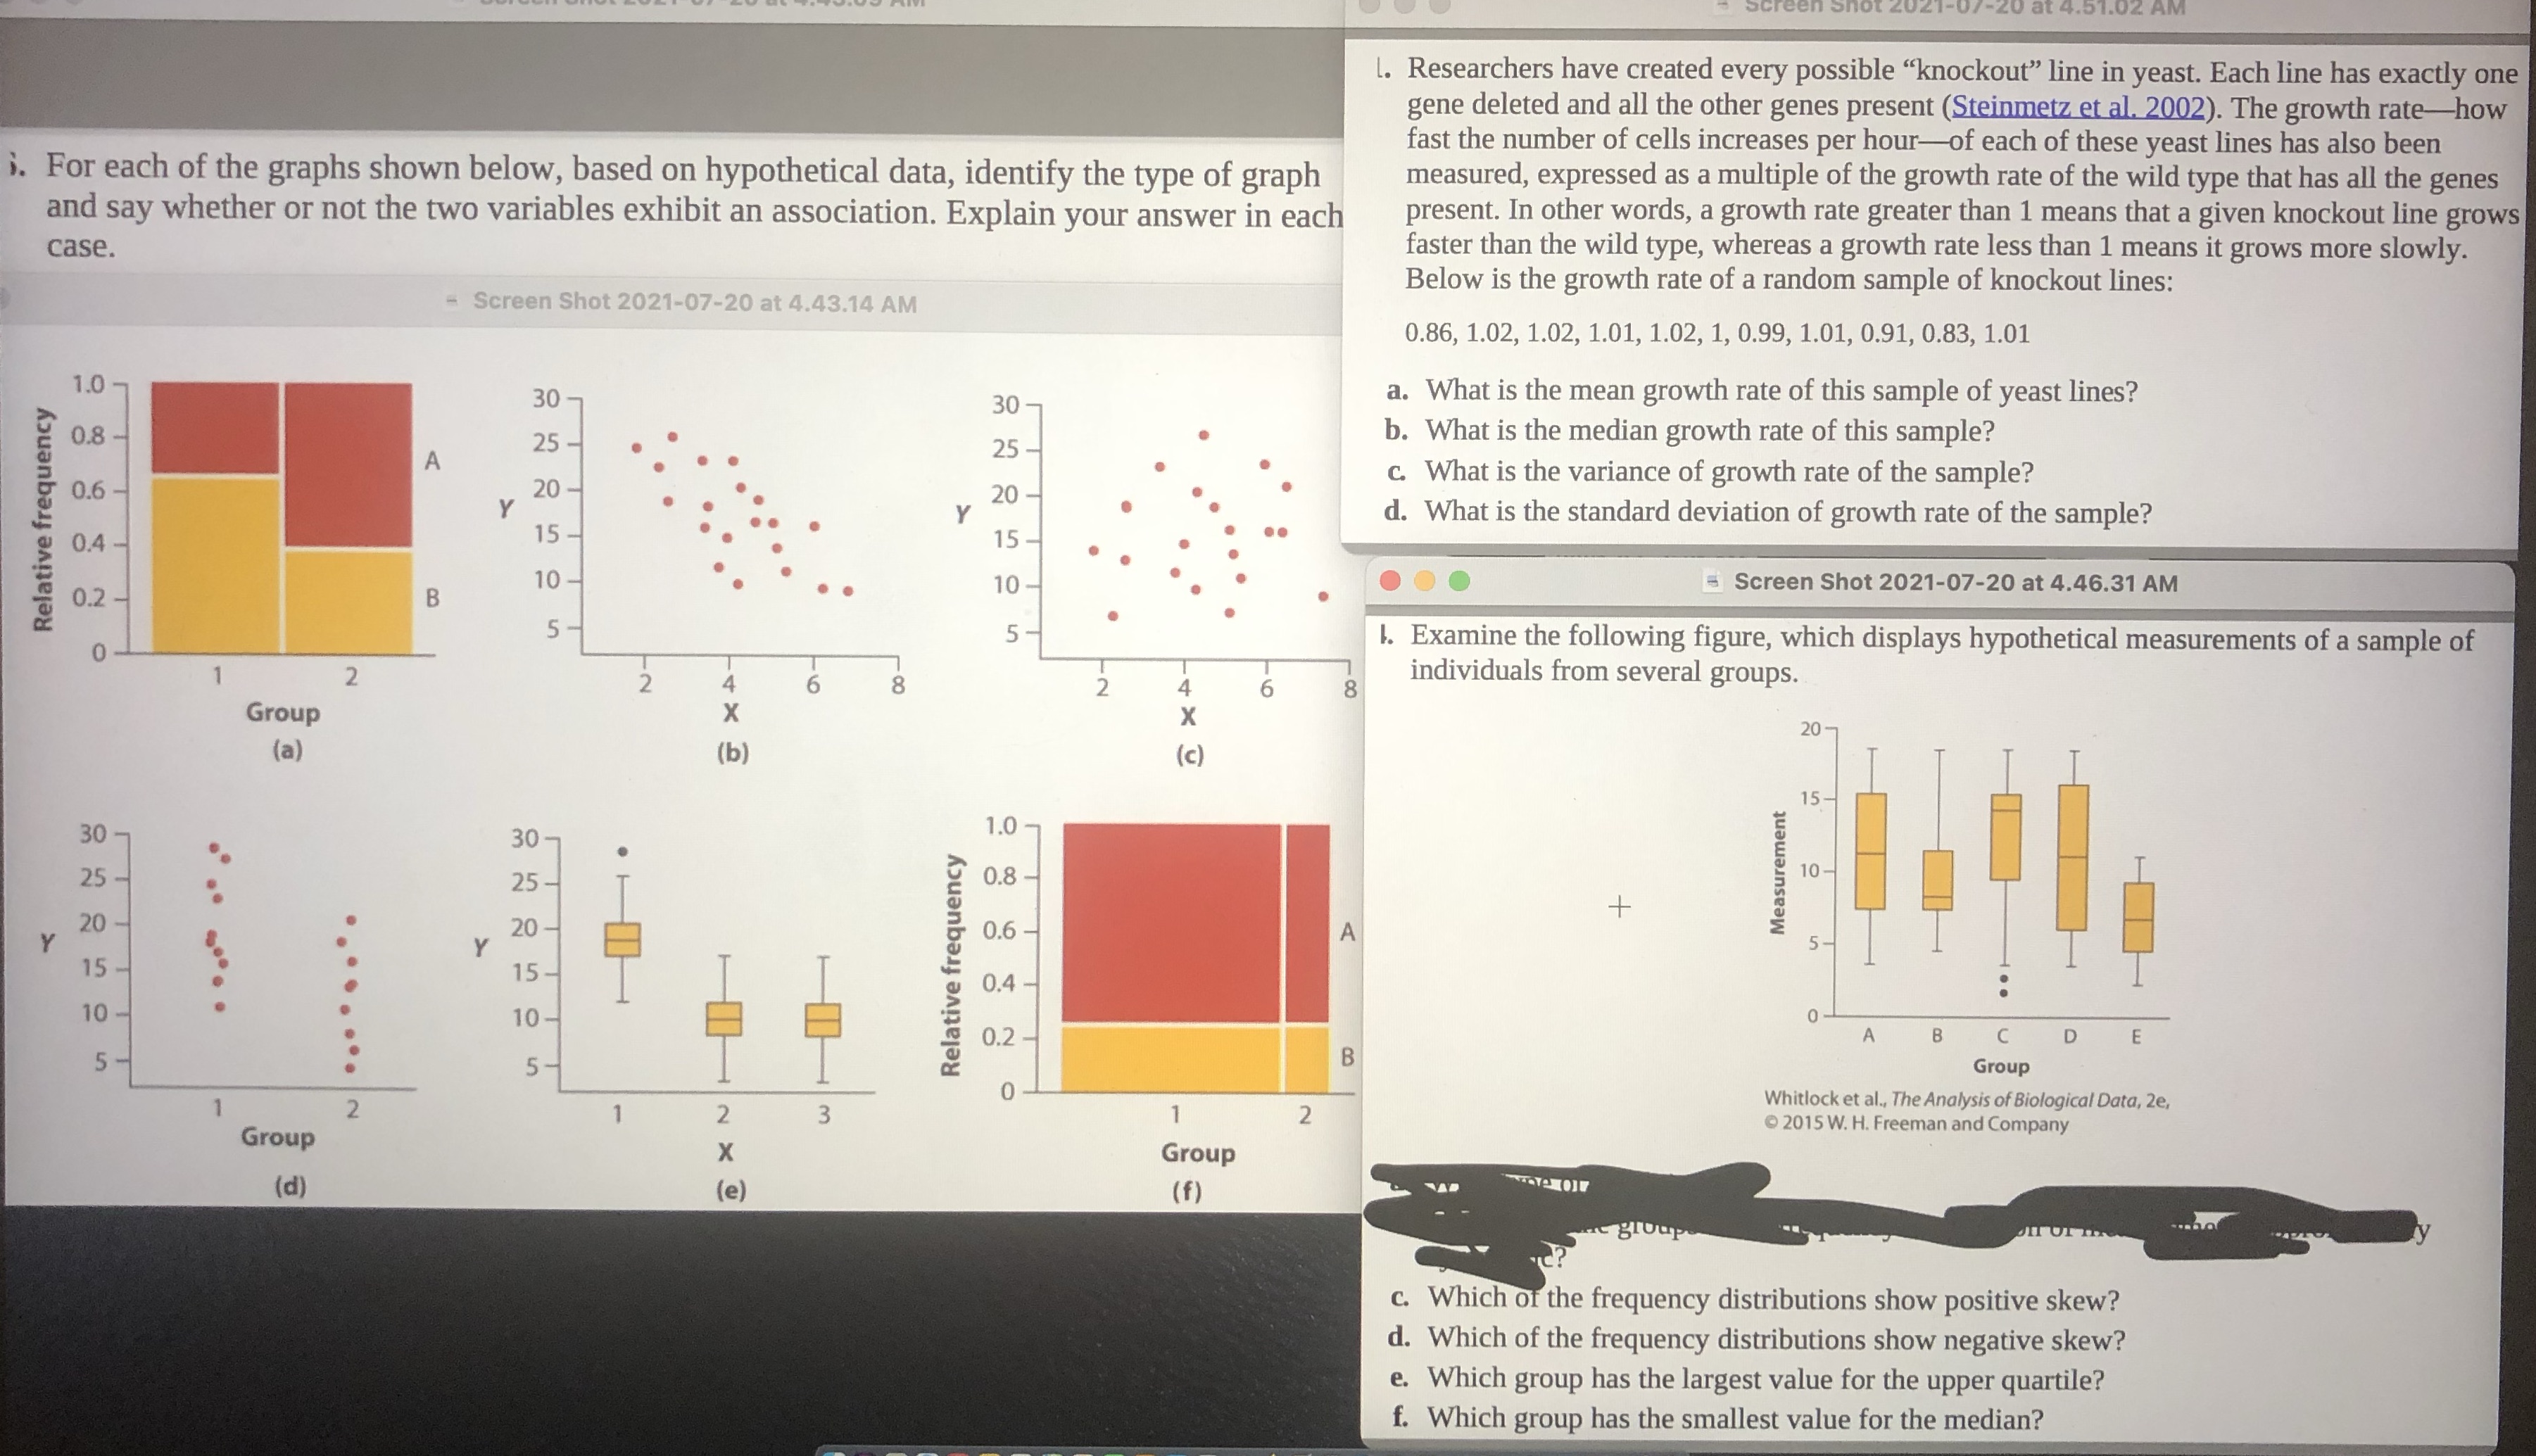
L. Researchers have created every possible "knockout" line in yeast. Each line has exactly one gene deleted and all the other genes present (Steinmetz et al. 2002). The growth rate-how fast the number of cells increases per hour-of each of these yeast lines has also been i. For each of the graphs shown below, based on hypothetical data, identify the type of graph measured, expressed as a multiple of the growth rate of the wild type that has all the genes and say whether or not the two variables exhibit an association. Explain your answer in each present. In other words, a growth rate greater than 1 means that a given knockout line grows case. faster than the wild type, whereas a growth rate less than 1 means it grows more slowly. Below is the growth rate of a random sample of knockout lines: - Screen Shot 2021-07-20 at 4.43.14 AM 0.86, 1.02, 1.02, 1.01, 1.02, 1, 0.99, 1.01, 0.91, 0.83, 1.01 1.0 30 30 - a. What is the mean growth rate of this sample of yeast lines? 0.8 25 - b. What is the median growth rate of this sample? 25 - A c. What is the variance of growth rate of the sample? 0.6 20 20 - y Y d. What is the standard deviation of growth rate of the sample? Relative frequency 0.4 15 15 - 10 10 .. . Screen Shot 2021-07-20 at 4.46.31 AM 0.2 5 5 1. Examine the following figure, which displays hypothetical measurements of a sample of 2 6 8 N- 6 8 individuals from several groups. X A- Group 20 -7 (a (b ) ( C ) 15 30 30- 1.0 0.8 Measurement 10 25 25 - .. 20 - 20 0.6 A y 5 Y 15 Relative frequency . ... 15 0.4 . . 10 . .. . . . " 10 B C B 5 Group O Whitlock et al., The Analysis of Biological Data, Ze, 2 3 1 2 2015 W. H. Freeman and Company Group X N Group (d) (e) (f) c. Which of the frequency distributions show positive skew? d. Which of the frequency distributions show negative skew? e. Which group has the largest value for the upper quartile? f. Which group has the smallest value for the median