PLEASE ANSWER ASAP AND WITH DETAILS
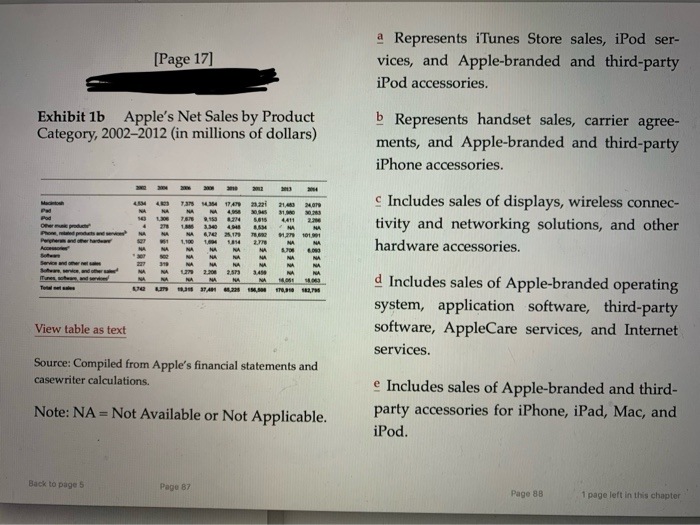
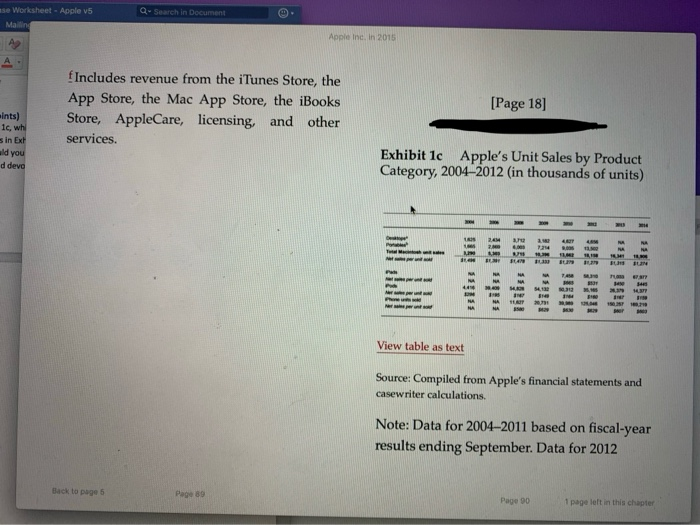
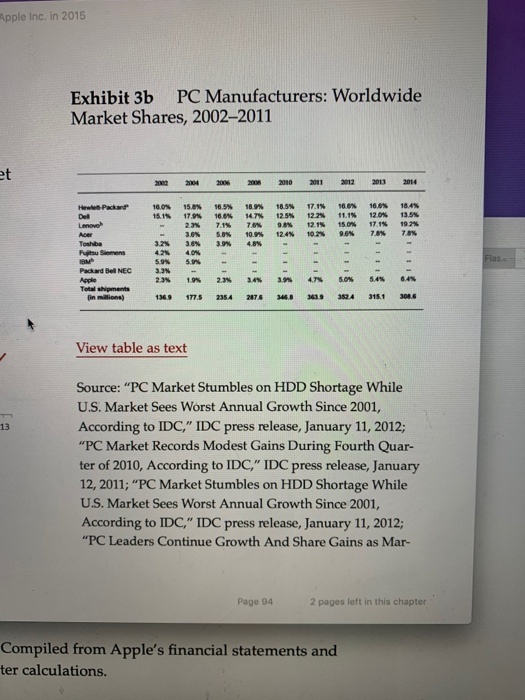
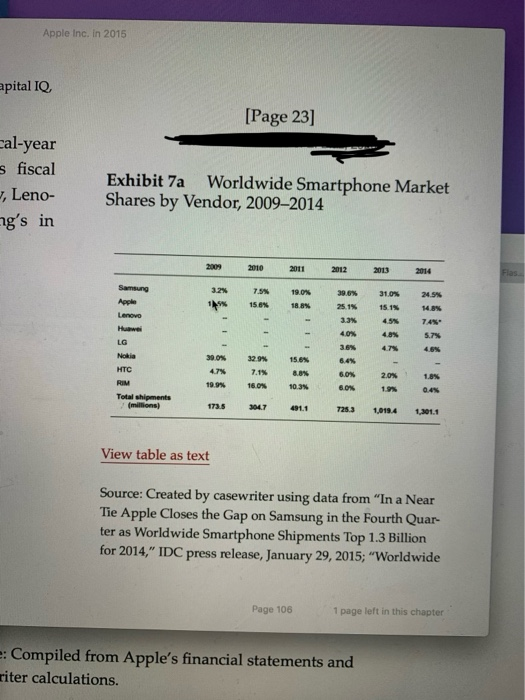
2. Apple's Shifting Priorities (25 points) Take a close look at Exhibits 1b and lc, which describe Apple's sales by product category. Also, look over the market share numbers in Exhibits 3b (PCs), 7a (smartphones), 8 (tablets). For each of the time periods below, how would you rank Apple's major product categories in terms of the amount of focus the company should devote to them? Be sure to support your answer with numbers from the case. 2002-2004: High Priority: Medium Priority: Low Priority: 2008-2010: High Priority: Medium Priority: Low Priority: 2014-onward: High Priority: Medium Priority: Low Priority: [Page 17] a Represents iTunes Store sales, iPod ser- vices, and Apple-branded and third-party iPod accessories. Exhibit 1b Apple's Net Sales by Product Category, 2002-2012 (in millions of dollars) b Represents handset sales, carrier agree- ments, and Apple-branded and third-party iPhone accessories. c Includes sales of displays, wireless connec- tivity and networking solutions, and other hardware accessories. 153535 d Includes sales of Apple-branded operating system, application software, third-party software, AppleCare services, and Internet services. View table as text Source: Compiled from Apple's financial statements and casewriter calculations. Note: NA = Not Available or Not Applicable. e Includes sales of Apple-branded and third- party accessories for iPhone, iPad, Mac, and iPod. Back to page 5 Page 87 Page 88 1 page left in this chapter Q- Search in Document use Worksheet - Apple v5 Mali Apple Inc. in 201 f Includes revenue from the iTunes Store, the App Store, the Mac App Store, the iBooks Store, AppleCare, licensing and other services. [Page 18] ints) ic, wh sin Ext uld you d deve Exhibit 1c Apple's Unit Sales by Product Category, 2004-2012 (in thousands of units) M. IN POP View table as text Source: Compiled from Apple's financial statements and casewriter calculations. Note: Data for 2004-2011 based on fiscal-year results ending September. Data for 2012 Back to page 5 Page 89 Page 1 page left in this chapter orksheet - Apple v5 QuSearch in Document Apple Inc. in 2015 reflect the latest 12 months ending March 31, 2012. Exhi Inde: $ a Includes iMac, Mac Mini, Mac Pro, and Xserve product lines. 2200 20000 b Includes MacBook, MacBook Air, and MacBook Pro product lines. 18000 16000 8 14001 12000 Dec. 1982 - 100 10000 Sales/unit includes accessories and related service revenue. 2000 Des 82 Source: One, acces Back to page 5 Page 91 Apple Inc. in 2015 Exhibit 3b PC Manufacturers: Worldwide Market Shares, 2002-2011 2 2004 2010 2009 2010 2011 2012 Hewes Packet 16.0% 15.15 15.8% 17.94 23 3.6% 3.6% 16.5% 16.6% 7.1% 5.8% 13.5% 18.99% 14.7 7.6% 10.9% 18.5% 12.5% 9.8% 124 17.1% 122 12.15 102% 16.6% 121 15.0 16.6% 12.0% 17.15 Lenovo 19.2% Toshiba Futume Packard Bell NEC 3.3 - - 12 8.45 Total shipments in milions) 13691775235 3624 315.1 301.6 View table as text Source: "PC Market Stumbles on HDD Shortage While U.S. Market Sees Worst Annual Growth Since 2001, According to IDC," IDC press release, January 11, 2012; "PC Market Records Modest Gains During Fourth Quar- ter of 2010, According to IDC," IDC press release, January 12, 2011; "PC Market Stumbles on HDD Shortage While U.S. Market Sees Worst Annual Growth Since 2001, According to IDC," IDC press release, January 11, 2012; "PC Leaders Continue Growth And Share Gains as Mar- Page 94 2 pages left in this chapter Compiled from Apple's financial statements and ter calculations. Apple Inc. in 2015 apital IQ [Page 23] cal-year s fiscal , Leno- ng's in Exhibit 7a Worldwide Smartphone Market Shares by Vendor, 2009-2014 2010 2013 2014 Samsung 31.0% 24.5% 14.8% Lenovo LG 96 Nokia HTC RIM 7.1% 16.0 19.9% 10.3% 0.4 Total shipments (millions) 304.7 491.1 1,0194 1,301.1 View table as text Source: Created by casewriter using data from "In a Near Tie Apple Closes the Gap on Samsung in the Fourth Quar- ter as Worldwide Smartphone Shipments Top 1.3 Billion for 2014," IDC press release, January 29, 2015; "Worldwide Page 106 1 page left in this chapter : Compiled from Apple's financial statements and riter calculations. 2. Apple's Shifting Priorities (25 points) Take a close look at Exhibits 1b and lc, which describe Apple's sales by product category. Also, look over the market share numbers in Exhibits 3b (PCs), 7a (smartphones), 8 (tablets). For each of the time periods below, how would you rank Apple's major product categories in terms of the amount of focus the company should devote to them? Be sure to support your answer with numbers from the case. 2002-2004: High Priority: Medium Priority: Low Priority: 2008-2010: High Priority: Medium Priority: Low Priority: 2014-onward: High Priority: Medium Priority: Low Priority: [Page 17] a Represents iTunes Store sales, iPod ser- vices, and Apple-branded and third-party iPod accessories. Exhibit 1b Apple's Net Sales by Product Category, 2002-2012 (in millions of dollars) b Represents handset sales, carrier agree- ments, and Apple-branded and third-party iPhone accessories. c Includes sales of displays, wireless connec- tivity and networking solutions, and other hardware accessories. 153535 d Includes sales of Apple-branded operating system, application software, third-party software, AppleCare services, and Internet services. View table as text Source: Compiled from Apple's financial statements and casewriter calculations. Note: NA = Not Available or Not Applicable. e Includes sales of Apple-branded and third- party accessories for iPhone, iPad, Mac, and iPod. Back to page 5 Page 87 Page 88 1 page left in this chapter Q- Search in Document use Worksheet - Apple v5 Mali Apple Inc. in 201 f Includes revenue from the iTunes Store, the App Store, the Mac App Store, the iBooks Store, AppleCare, licensing and other services. [Page 18] ints) ic, wh sin Ext uld you d deve Exhibit 1c Apple's Unit Sales by Product Category, 2004-2012 (in thousands of units) M. IN POP View table as text Source: Compiled from Apple's financial statements and casewriter calculations. Note: Data for 2004-2011 based on fiscal-year results ending September. Data for 2012 Back to page 5 Page 89 Page 1 page left in this chapter orksheet - Apple v5 QuSearch in Document Apple Inc. in 2015 reflect the latest 12 months ending March 31, 2012. Exhi Inde: $ a Includes iMac, Mac Mini, Mac Pro, and Xserve product lines. 2200 20000 b Includes MacBook, MacBook Air, and MacBook Pro product lines. 18000 16000 8 14001 12000 Dec. 1982 - 100 10000 Sales/unit includes accessories and related service revenue. 2000 Des 82 Source: One, acces Back to page 5 Page 91 Apple Inc. in 2015 Exhibit 3b PC Manufacturers: Worldwide Market Shares, 2002-2011 2 2004 2010 2009 2010 2011 2012 Hewes Packet 16.0% 15.15 15.8% 17.94 23 3.6% 3.6% 16.5% 16.6% 7.1% 5.8% 13.5% 18.99% 14.7 7.6% 10.9% 18.5% 12.5% 9.8% 124 17.1% 122 12.15 102% 16.6% 121 15.0 16.6% 12.0% 17.15 Lenovo 19.2% Toshiba Futume Packard Bell NEC 3.3 - - 12 8.45 Total shipments in milions) 13691775235 3624 315.1 301.6 View table as text Source: "PC Market Stumbles on HDD Shortage While U.S. Market Sees Worst Annual Growth Since 2001, According to IDC," IDC press release, January 11, 2012; "PC Market Records Modest Gains During Fourth Quar- ter of 2010, According to IDC," IDC press release, January 12, 2011; "PC Market Stumbles on HDD Shortage While U.S. Market Sees Worst Annual Growth Since 2001, According to IDC," IDC press release, January 11, 2012; "PC Leaders Continue Growth And Share Gains as Mar- Page 94 2 pages left in this chapter Compiled from Apple's financial statements and ter calculations. Apple Inc. in 2015 apital IQ [Page 23] cal-year s fiscal , Leno- ng's in Exhibit 7a Worldwide Smartphone Market Shares by Vendor, 2009-2014 2010 2013 2014 Samsung 31.0% 24.5% 14.8% Lenovo LG 96 Nokia HTC RIM 7.1% 16.0 19.9% 10.3% 0.4 Total shipments (millions) 304.7 491.1 1,0194 1,301.1 View table as text Source: Created by casewriter using data from "In a Near Tie Apple Closes the Gap on Samsung in the Fourth Quar- ter as Worldwide Smartphone Shipments Top 1.3 Billion for 2014," IDC press release, January 29, 2015; "Worldwide Page 106 1 page left in this chapter : Compiled from Apple's financial statements and riter calculations