please answer both questions 9 and 10 as they are linked and are 1 question. if you do not you will get a thumbs down.
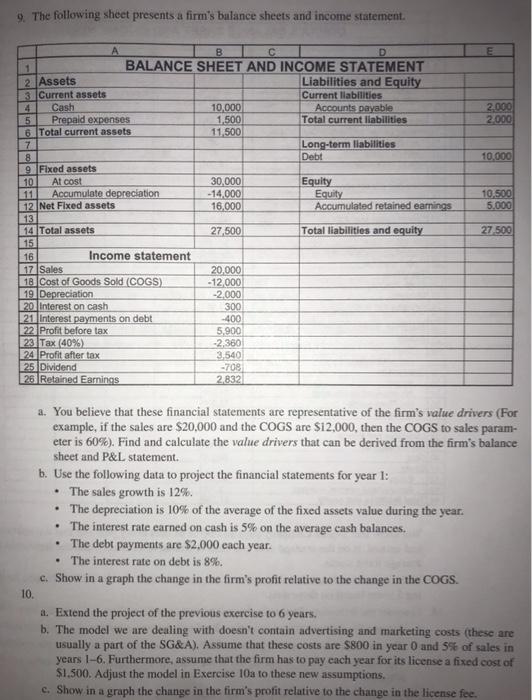
9. The following sheet presents a firm's balance sheets and income statement. E 2.000 2.000 10,000 10.500 5.000 B D 1 BALANCE SHEET AND INCOME STATEMENT 2 Assets Liabilities and Equity 3 Current assets Current liabilities 4 Cash 10,000 Accounts payable 5 Prepaid expenses 1,500 Total current liabilities 6 Total current assets 11.500 7 Long-term liabilities 8 Debt 9 Fixed assets 10 At cost 30,000 Equity 11 Accumulate depreciation -14.000 Equity 12 Net Fixed assets 16.000 Accumulated retained earnings 13 14 Total assets 27,500 Total liabilities and equity 15 16 Income statement 17 Sales 20,000 18 Cost of Goods Sold (COGS) -12 000 19 Depreciation -2.000 20 Interest on cash 21. Interest payments on debt -400 22 Profit before tax 5,900 23 Tax (40%) 2.360 24 Profit after tax 3.540 25 Dividend -708 26 Retained Earnings 2,832 27500 300 a. You believe that these financial statements are representative of the firm's value drivers (For example, if the sales are $20,000 and the COGS are $12,000, then the COGS to sales param- eter is 60%). Find and calculate the value drivers that can be derived from the firm's balance sheet and P&L statement . Use the following data to project the financial statements for year 1: The sales growth is 12%. The depreciation is 10% of the average of the fixed assets value during the year. The interest rate earned on cash is 5% on the average cash balances. The debt payments are $2.000 each year. The interest rate on debt is 8%. c. Show in a graph the change in the firm's profit relative to the change in the COGS. 10. a. Extend the project of the previous exercise to 6 years. b. The model we are dealing with doesn't contain advertising and marketing costs (these are usually a part of the SG&A). Assume that these costs are $800 in year 0 and 5% of sales in years 1-6. Furthermore, assume that the firm has to pay each year for its license a fixed cost of $1,500. Adjust the model in Exercise 10a to these new assumptions. c. Show in a graph the change in the firm's profit relative to the change in the license fee. 9. The following sheet presents a firm's balance sheets and income statement. E 2.000 2.000 10,000 10.500 5.000 B D 1 BALANCE SHEET AND INCOME STATEMENT 2 Assets Liabilities and Equity 3 Current assets Current liabilities 4 Cash 10,000 Accounts payable 5 Prepaid expenses 1,500 Total current liabilities 6 Total current assets 11.500 7 Long-term liabilities 8 Debt 9 Fixed assets 10 At cost 30,000 Equity 11 Accumulate depreciation -14.000 Equity 12 Net Fixed assets 16.000 Accumulated retained earnings 13 14 Total assets 27,500 Total liabilities and equity 15 16 Income statement 17 Sales 20,000 18 Cost of Goods Sold (COGS) -12 000 19 Depreciation -2.000 20 Interest on cash 21. Interest payments on debt -400 22 Profit before tax 5,900 23 Tax (40%) 2.360 24 Profit after tax 3.540 25 Dividend -708 26 Retained Earnings 2,832 27500 300 a. You believe that these financial statements are representative of the firm's value drivers (For example, if the sales are $20,000 and the COGS are $12,000, then the COGS to sales param- eter is 60%). Find and calculate the value drivers that can be derived from the firm's balance sheet and P&L statement . Use the following data to project the financial statements for year 1: The sales growth is 12%. The depreciation is 10% of the average of the fixed assets value during the year. The interest rate earned on cash is 5% on the average cash balances. The debt payments are $2.000 each year. The interest rate on debt is 8%. c. Show in a graph the change in the firm's profit relative to the change in the COGS. 10. a. Extend the project of the previous exercise to 6 years. b. The model we are dealing with doesn't contain advertising and marketing costs (these are usually a part of the SG&A). Assume that these costs are $800 in year 0 and 5% of sales in years 1-6. Furthermore, assume that the firm has to pay each year for its license a fixed cost of $1,500. Adjust the model in Exercise 10a to these new assumptions. c. Show in a graph the change in the firm's profit relative to the change in the license fee