

Answered step by step
Verified Expert Solution
Question
1 Approved Answer
Please answer each part in Excel with proper labels and formulas showing all calculations for a great rating. Thank you! P 8-7 Selected financial data
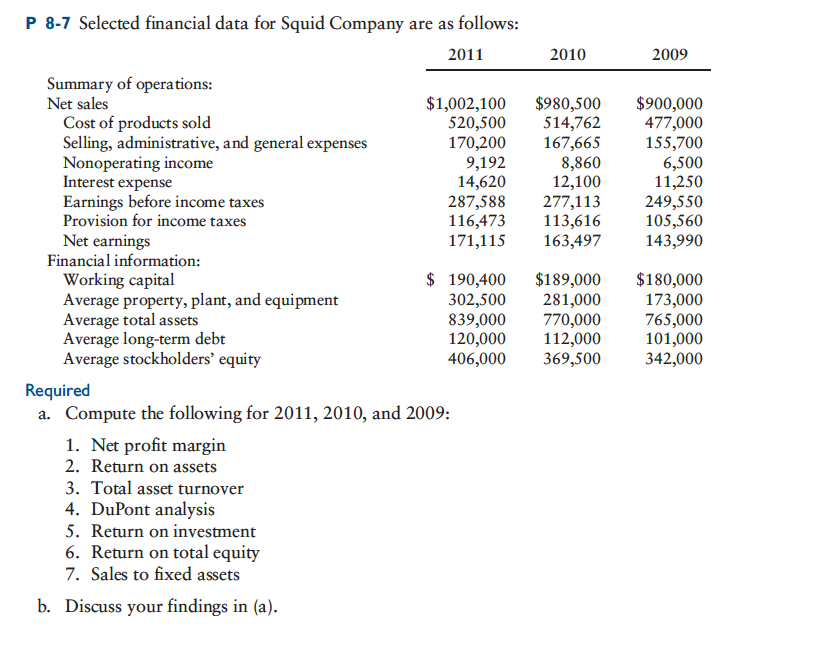
Please answer each part in Excel with proper labels and formulas showing all calculations for a great rating. Thank you!
P 8-7 Selected financial data for Squid Company are as follows 2011 2010 2009 Summary of operations Net sales Cost of products sold Selling, administrative, and general expenses Nonoperating income Interest expense Earnings before income taxes Provision for income taxes Net earnings $1,002,100 $980,500 $900,000 520,500 514,762 477,000 155,700 6,500 11,250 287,588 277,113 249,550 116,473 113,616 105,560 171,115 163,497143,990 170,200 167,665 8,860 12,100 9,192 14,620 Financial information Working capital Average property, plant, and equipment Average total assets Average long-term debt Average stockholders' equity $ 190,400 $189,000 $180,000 302,500 281,000 173,000 765,000 120,000 112,000 101,000 406,000 369,500 342,000 839,000 770,000 Required a. Compute the following for 2011, 2010, and 2009: 1. Net profit margin 2. Return on assets 3. Total asset turnover 4. DuPont analysis 5. Return on investment 6. Return on total equity 7. Sales to fixed assets b. Discuss your findings in (a)Step by Step Solution
There are 3 Steps involved in it
Step: 1

Get Instant Access to Expert-Tailored Solutions
See step-by-step solutions with expert insights and AI powered tools for academic success
Step: 2

Step: 3
Ace Your Homework with AI
Get the answers you need in no time with our AI-driven, step-by-step assistance
Get Started
Independent Review For Banks The Complete BSA AML Audit Workbook
Authors: Howard Steiner, Stephen L. Marini
1st Edition
0615237908, 978-0615237909