Please answer ecah sub questions, Thanks!
https://www.briancjenkins.com/data/us.html
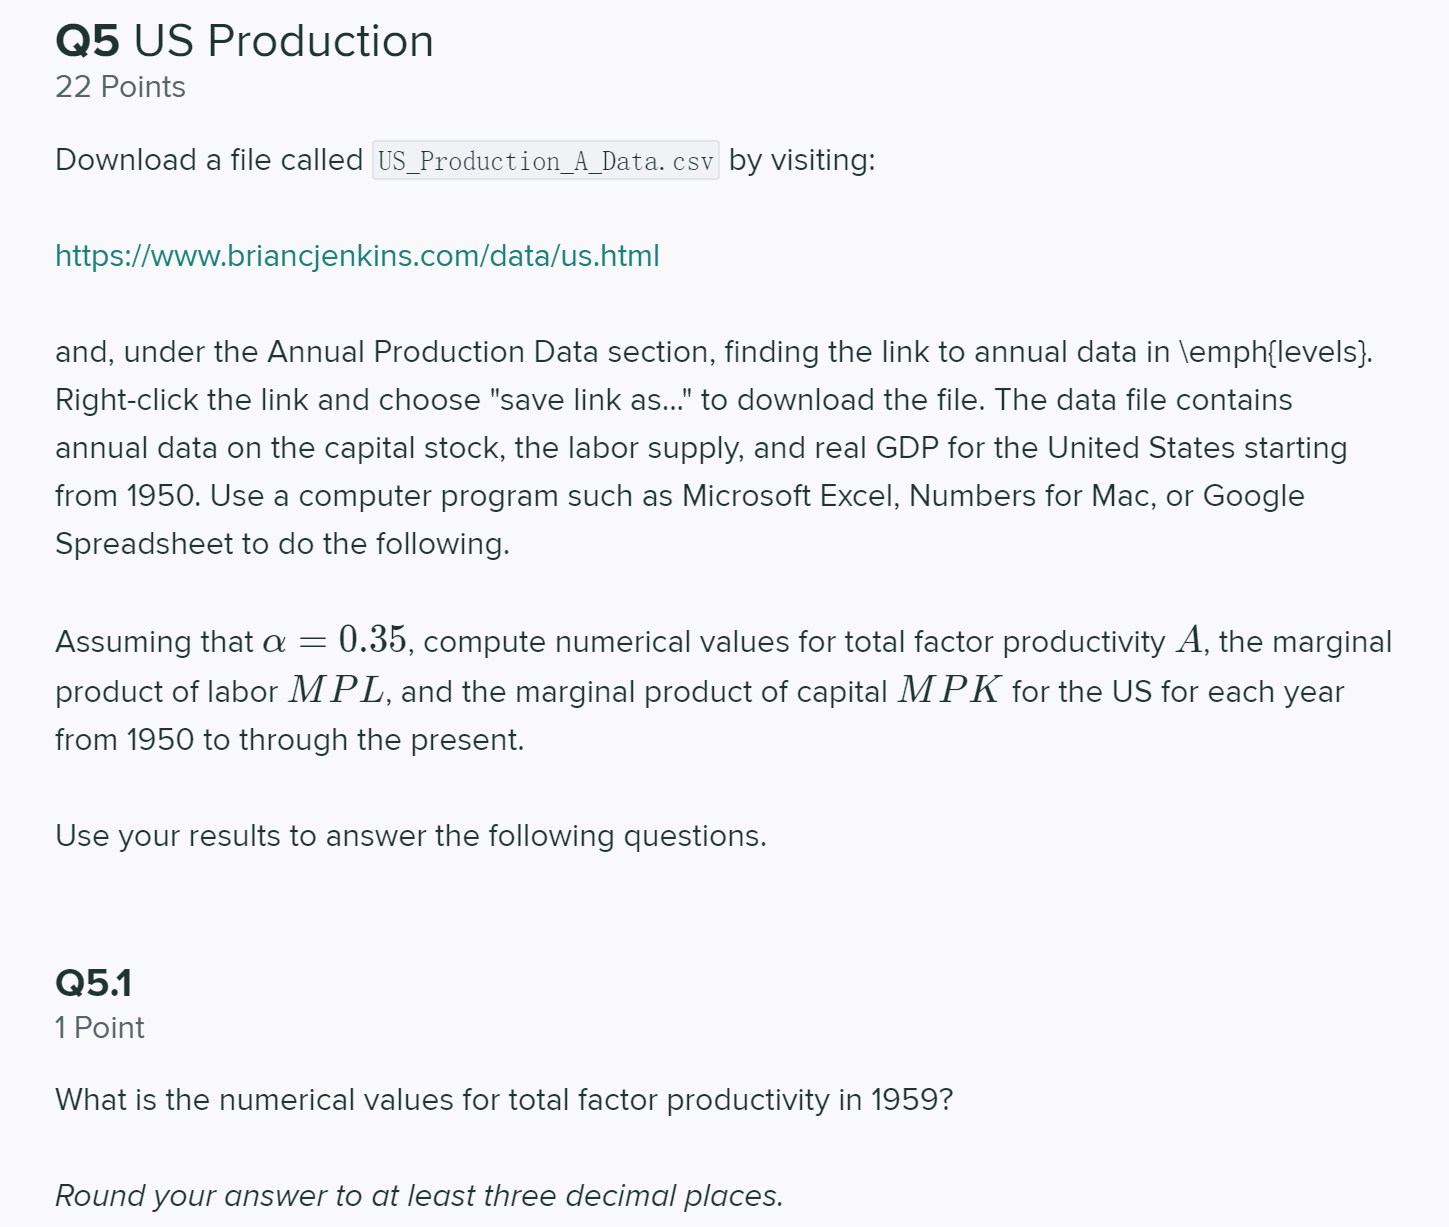
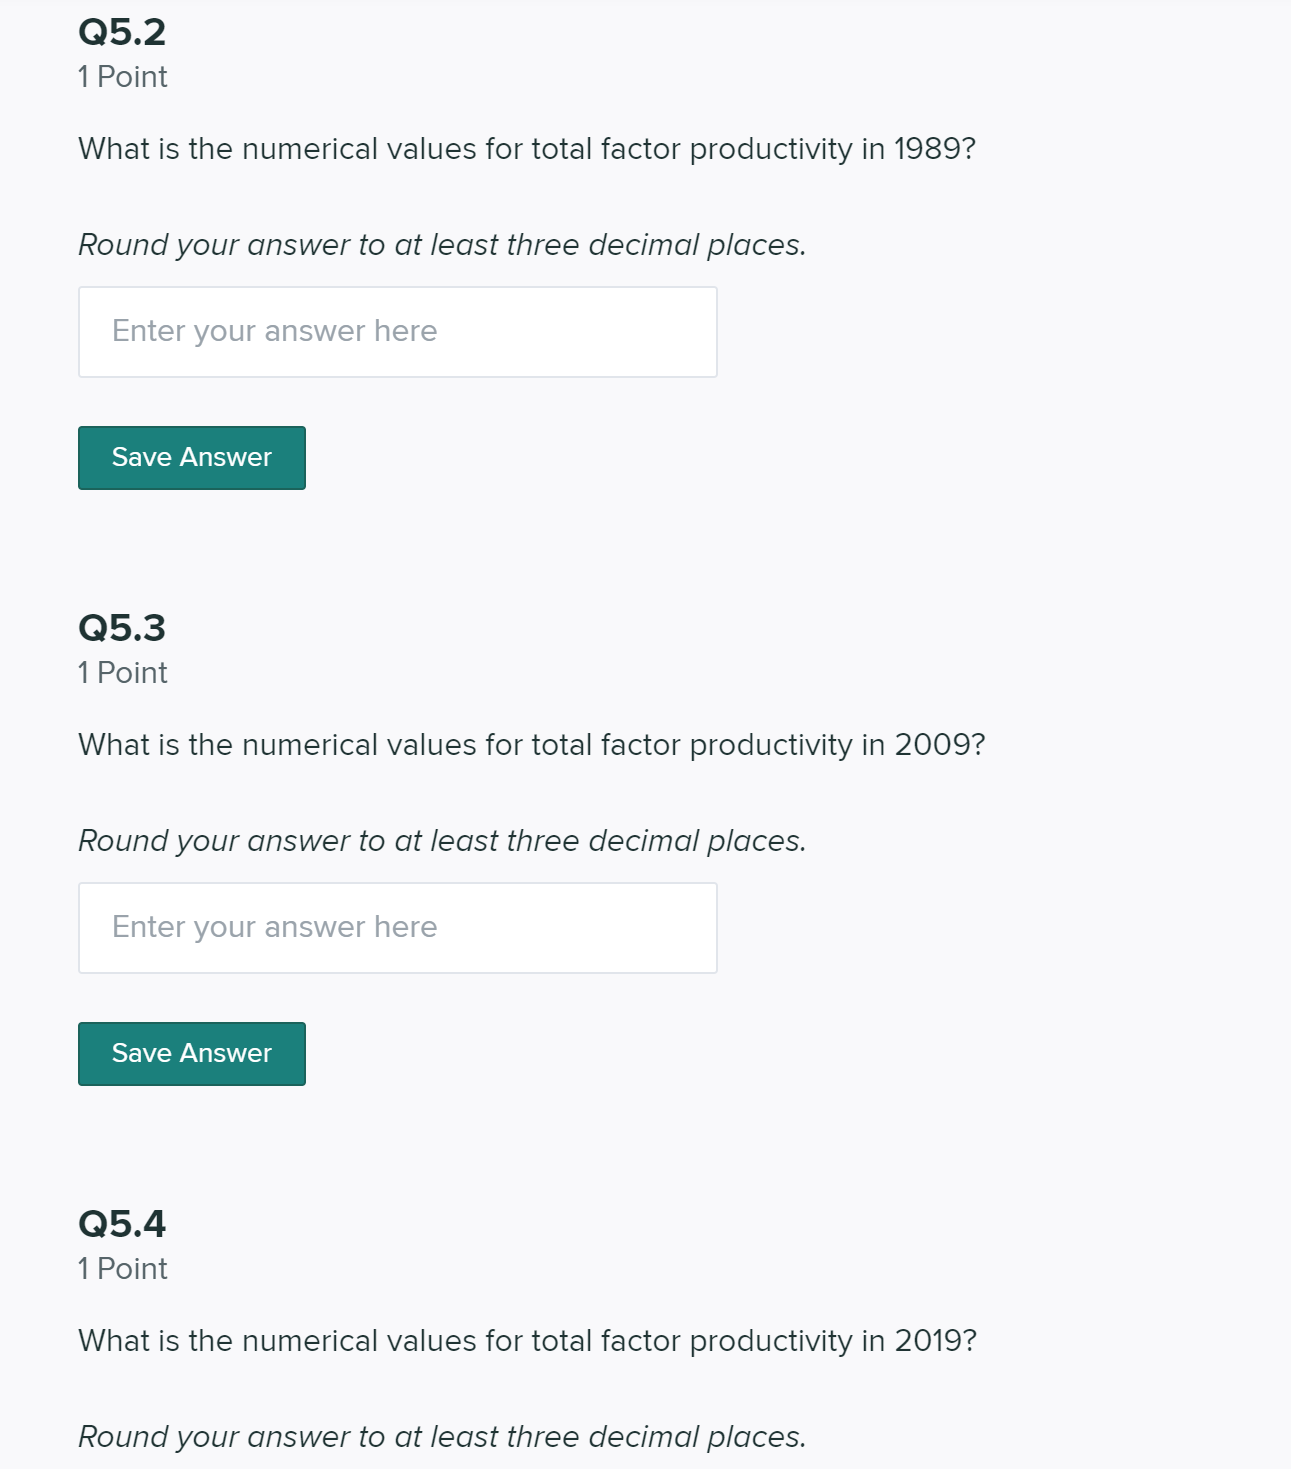
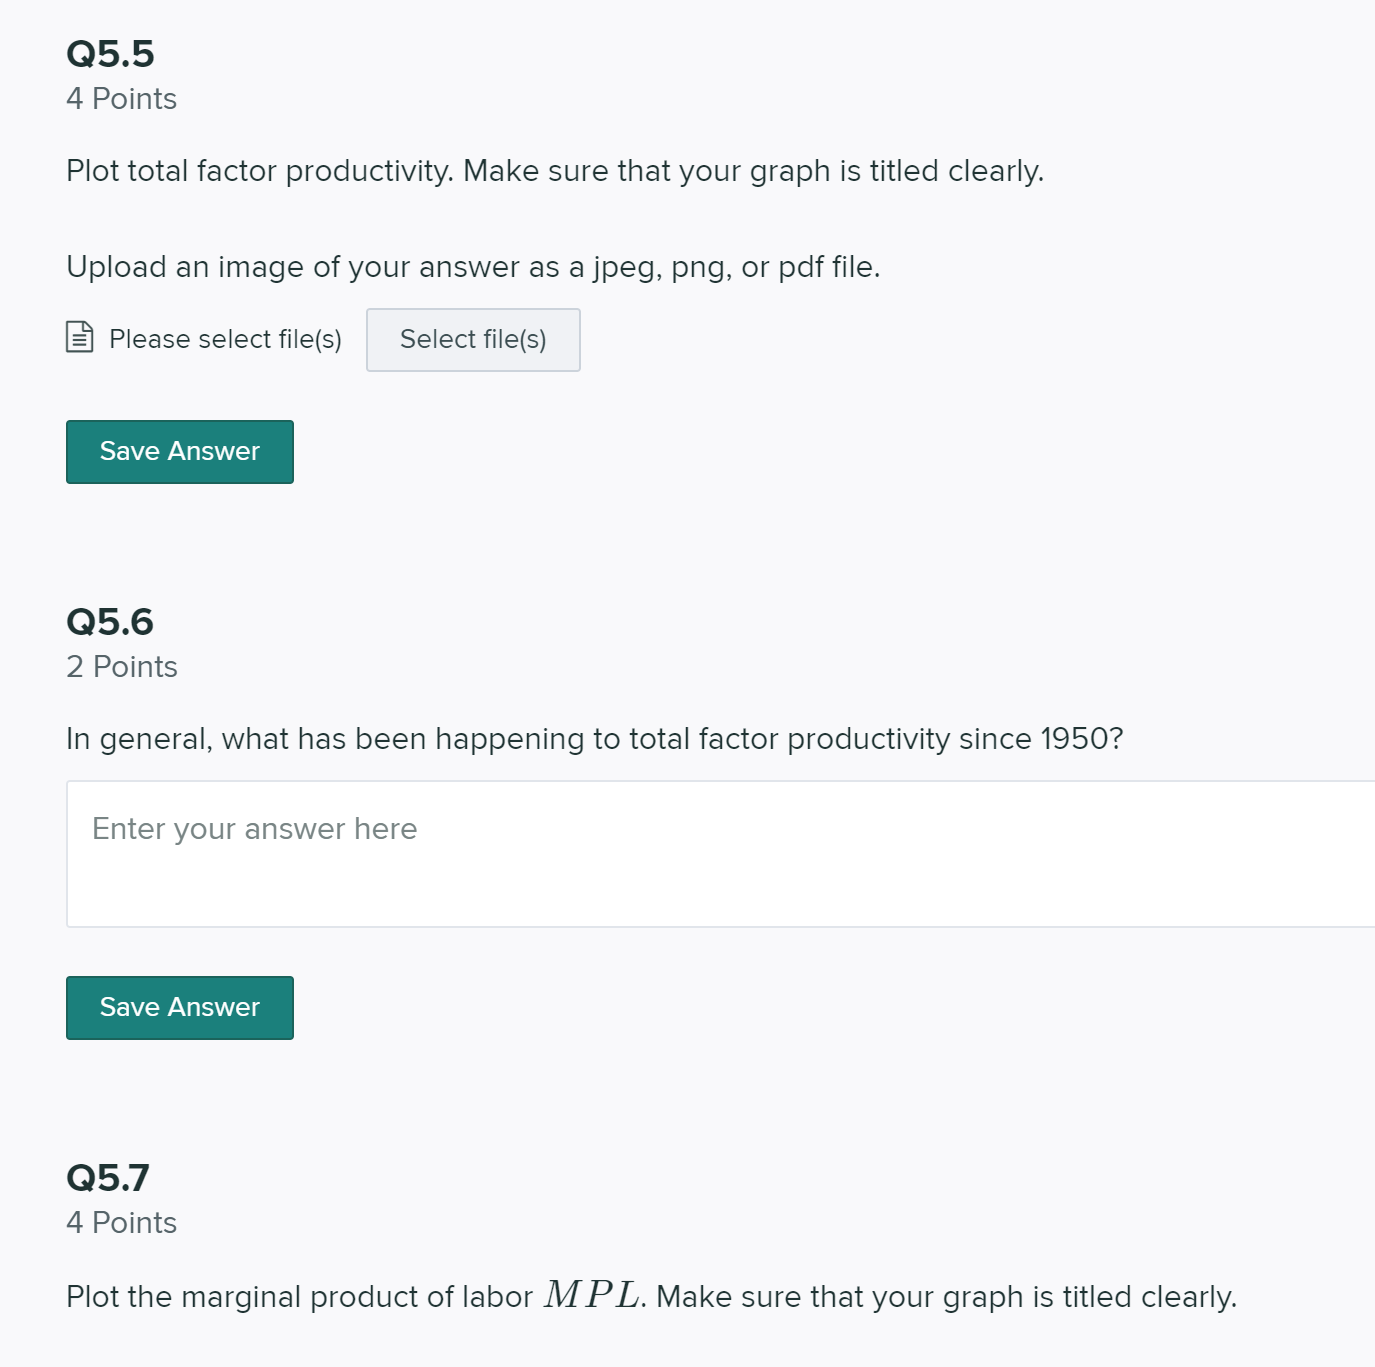
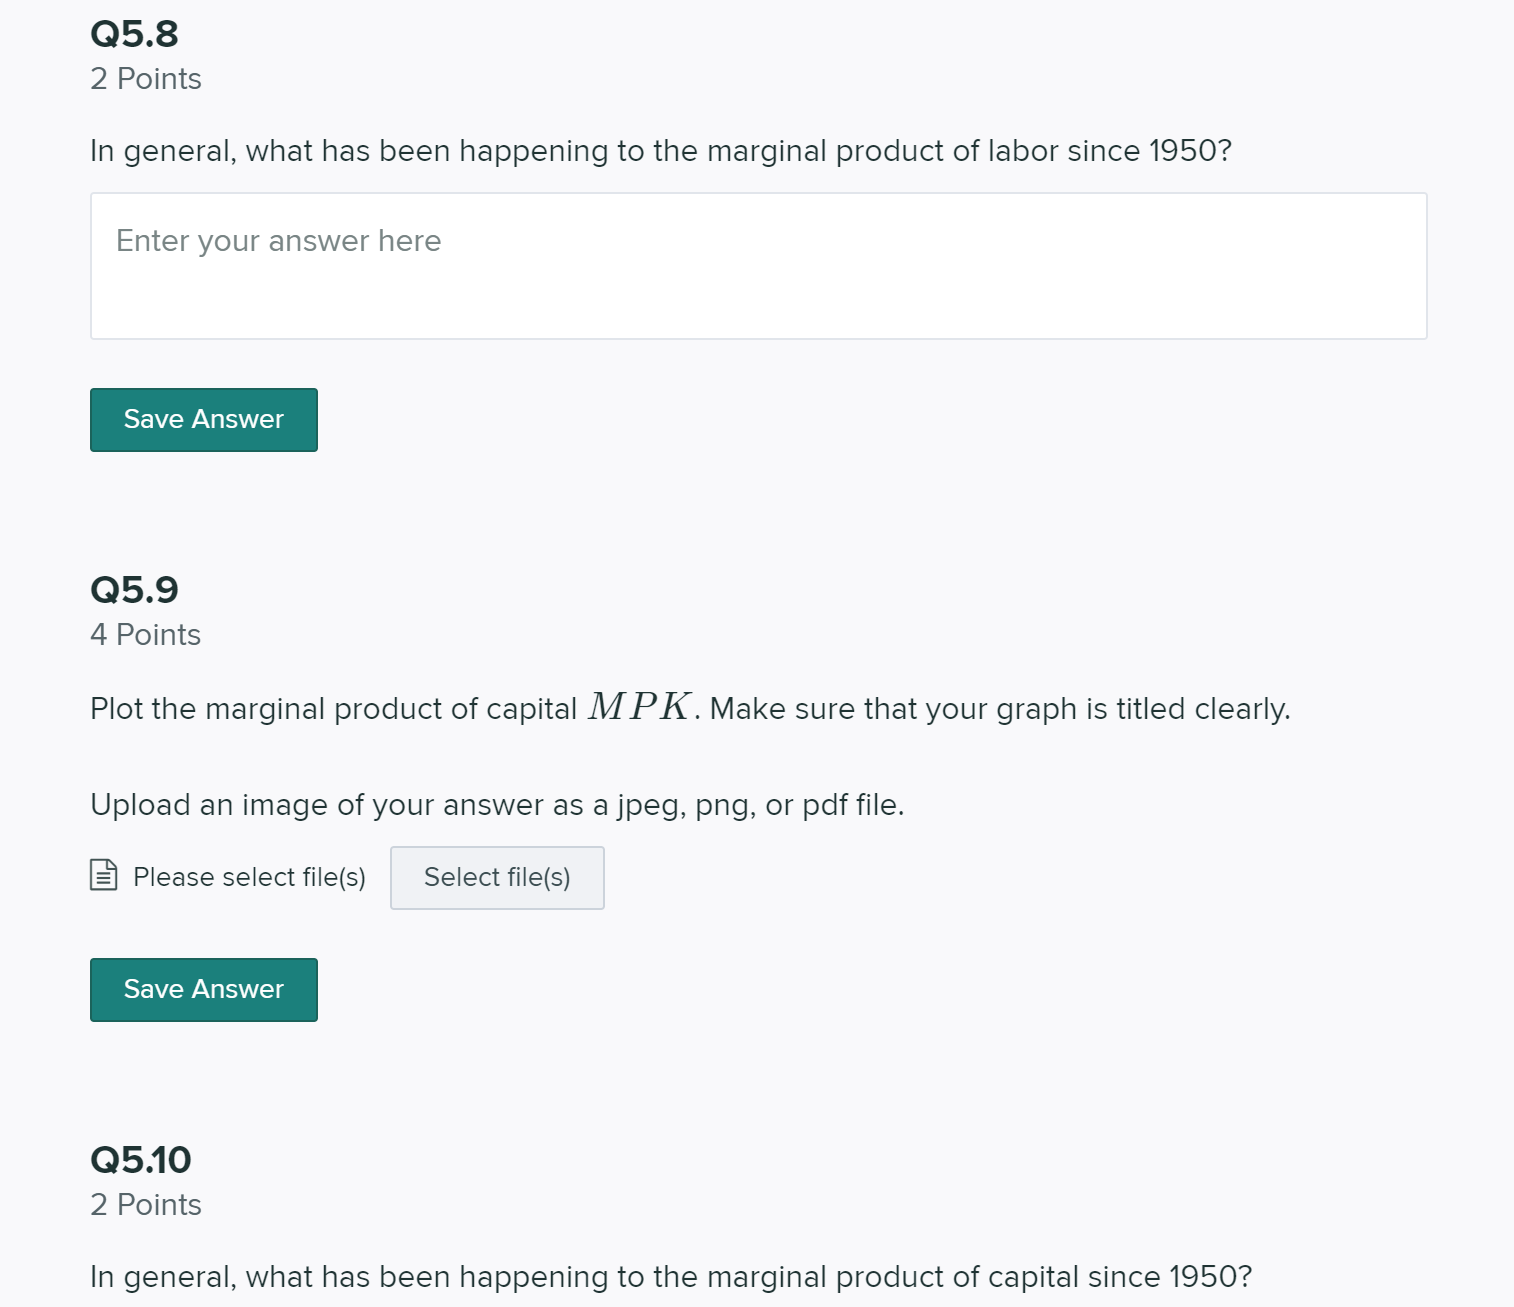
05 US Production 22 Points Download a file called US_Production_A_Data. csv by visiting: https://www.briancjenkins.com/data/us.htm| and, under the Annual Production Data section, finding the link to annual data in \\emph{levels}. Rightclick the link and choose "save link as..." to download the file. The data file contains annual data on the capital stock, the labor supply, and real GDP for the United States starting from 1950. Use a computer program such as Microsoft Excel, Numbers for Mac, or Google Spreadsheet to do the following. Assuming that a = 0.35, compute numerical values for total factor productivity A, the marginal product of labor MPL, and the marginal product of capital MPK for the US for each year from 1950 to through the present. Use your results to answer the following questions. 05.1 1 Point What is the numerical values for total factor productivity in 1959? Round your answer to at least three decima.l places. 05.2 1 Point What is the numerical values for total factor productivity in 1989? Round your answer to at least three decimal places. Enter your answer here Save Answer 05.3 1 Point What is the numerical values for total factor productivity in 2009? Round your answer to at least three decimal places. Enter your answer here Save Answer 05.4 1 Point What is the numerical values for total factor productivity in 2019? Round your answer to at least three decimal places. Q5.5 4 Points Plot total factor productivity. Make sure that your graph is titled clearly. Upload an image of your answer as a jpeg, png, or pdf file. Please select file(s) Select file(s) Save Answer Q5.6 2 Points In general, what has been happening to total factor productivity since 1950? Enter your answer here Save Answer Q5.7 4 Points Plot the marginal product of labor MP L. Make sure that your graph is titled clearly.053 2 Points In general, what has been happening to the marginal product of labor since 1950? Enter your answer here Save Answer 053 4 Points Plot the marginal product of capital MPK. Make sure that your graph is titled clearly. Upload an image of your answer as a jpeg, png, or pdf file. E Please select fi|e(s) Select file(s) Save Answer 0530 2 Points In general, what has been happening to the marginal product of capital since 1950


