

Answered step by step
Verified Expert Solution
Question
1 Approved Answer
please answer full question, will leave great review Section 1: Seasonal Indicator Regression For the Johnson & Johnson data, say Je, let X = log(J.).
please answer full question, will leave great review
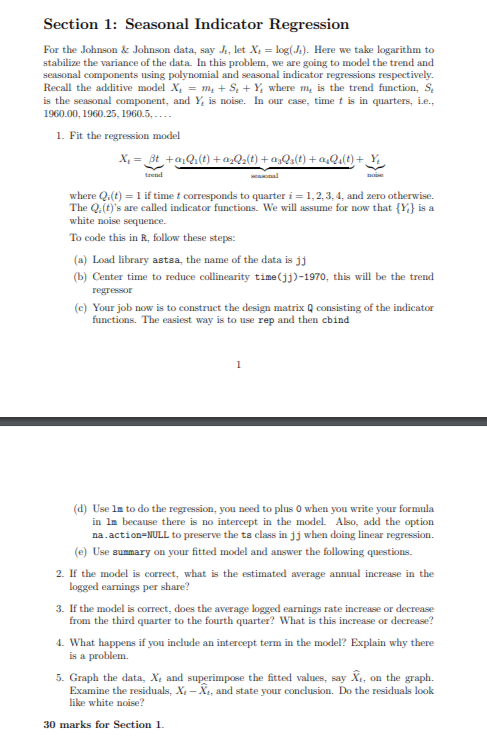
Section 1: Seasonal Indicator Regression For the Johnson & Johnson data, say Je, let X = log(J.). Here we take logarithm to stabilize the variance of the data. In this problem, we are going to model the trend and seasonal components using polynomial and seasonal indicator regressions respectively. Recall the additive model x, = mx +Se+ Y, where me is the trend function, S. is the seasonal component, and Y. is noise. In our case, time t is in quarters, i.e., 1960.00, 1960.25, 1960,5..... 1. Fit the regression model X. = Bt + Q.(t) + 0,02(t) +0,03(t) + 4Q_(t)+Y where Q:(t) = 1 if time t corresponds to quarter i = 1,2,3,4, and zero otherwise. The Q. t)'s are called indicator functions. We will assume for now that {Y} is a white noise sequence. To code this in R, follow these steps: (a) Load library astea, the name of the data is jj (b) Center time to reduce collinearity time(jj)-1970, this will be the trend regressor (C) Your job now is to construct the design matrix Q consisting of the indicator functions. The easiest way is to use rep and then cbind 1 (d) Use la to do the regression, you need to plus O when you write your formula in ln because there is no intercept in the model. Also, add the option na action=NULL to preserve the ts class in jj when doing linear regression. (e) Use summary on your fitted model and answer the following questions. 2. If the model is correct, what is the estimated average annual increase in the logged earnings per share? 3. If the model is correct, does the average logged earnings rate increase or decrease from the third quarter to the fourth quarter? What is this increase or decrease? 4. What happens if you include an intercept term in the model? Explain why there is a problem. 5. Graph the data, Xe and superimpose the fitted values, say Xe, on the graph. Examine the residuals, X-, and state your conclusion. Do the residuals look like white noise? 30 marks for Section 1. Section 1: Seasonal Indicator Regression For the Johnson & Johnson data, say Je, let X = log(J.). Here we take logarithm to stabilize the variance of the data. In this problem, we are going to model the trend and seasonal components using polynomial and seasonal indicator regressions respectively. Recall the additive model x, = mx +Se+ Y, where me is the trend function, S. is the seasonal component, and Y. is noise. In our case, time t is in quarters, i.e., 1960.00, 1960.25, 1960,5..... 1. Fit the regression model X. = Bt + Q.(t) + 0,02(t) +0,03(t) + 4Q_(t)+Y where Q:(t) = 1 if time t corresponds to quarter i = 1,2,3,4, and zero otherwise. The Q. t)'s are called indicator functions. We will assume for now that {Y} is a white noise sequence. To code this in R, follow these steps: (a) Load library astea, the name of the data is jj (b) Center time to reduce collinearity time(jj)-1970, this will be the trend regressor (C) Your job now is to construct the design matrix Q consisting of the indicator functions. The easiest way is to use rep and then cbind 1 (d) Use la to do the regression, you need to plus O when you write your formula in ln because there is no intercept in the model. Also, add the option na action=NULL to preserve the ts class in jj when doing linear regression. (e) Use summary on your fitted model and answer the following questions. 2. If the model is correct, what is the estimated average annual increase in the logged earnings per share? 3. If the model is correct, does the average logged earnings rate increase or decrease from the third quarter to the fourth quarter? What is this increase or decrease? 4. What happens if you include an intercept term in the model? Explain why there is a problem. 5. Graph the data, Xe and superimpose the fitted values, say Xe, on the graph. Examine the residuals, X-, and state your conclusion. Do the residuals look like white noise? 30 marks for Section 1Step by Step Solution
There are 3 Steps involved in it
Step: 1

Get Instant Access to Expert-Tailored Solutions
See step-by-step solutions with expert insights and AI powered tools for academic success
Step: 2

Step: 3
Ace Your Homework with AI
Get the answers you need in no time with our AI-driven, step-by-step assistance
Get Started
Monetary Policy And Public Finance
Authors: G. C. Hockley
1st Edition
1138704792, 978-1138704794