

Answered step by step
Verified Expert Solution
Question
1 Approved Answer
please answer full question write neatly Draw a graph based on the following data: Solubility (g of salt/100g 2.16 3.44 4.23 5.546.22 7.55 8.32 of
please answer full question write neatly 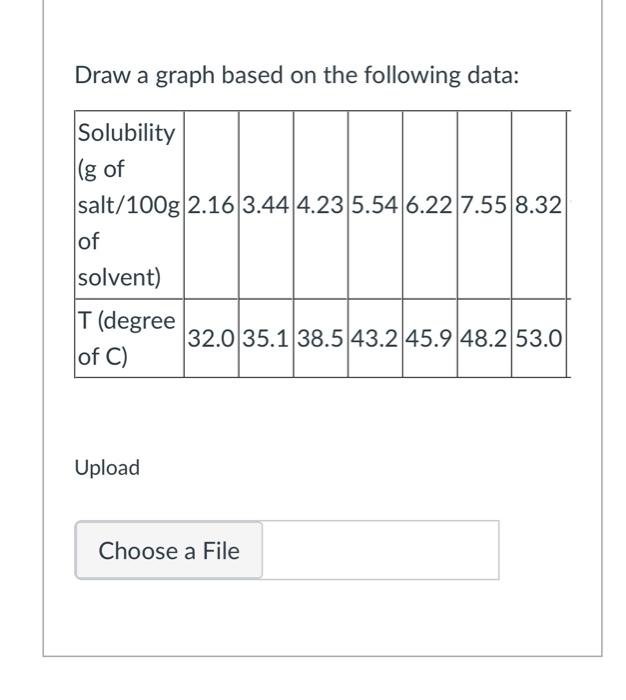
Draw a graph based on the following data: Solubility (g of salt/100g 2.16 3.44 4.23 5.546.22 7.55 8.32 of solvent) T (degree 32.0 35.1 38.5 43.2 45.9 48.2 53.0 of C) Upload Choose a File a Based on the Solubility vs T graph, you have drawn. Calculate the slope, y-intercept and the equation of the line. Upload Step by Step Solution
There are 3 Steps involved in it
Step: 1

Get Instant Access to Expert-Tailored Solutions
See step-by-step solutions with expert insights and AI powered tools for academic success
Step: 2

Step: 3
Ace Your Homework with AI
Get the answers you need in no time with our AI-driven, step-by-step assistance
Get Started
Chemistry
Authors: Raymond Chang
10th edition
77274318, 978-0077274313