Please answer part a and b as they are related
thank you
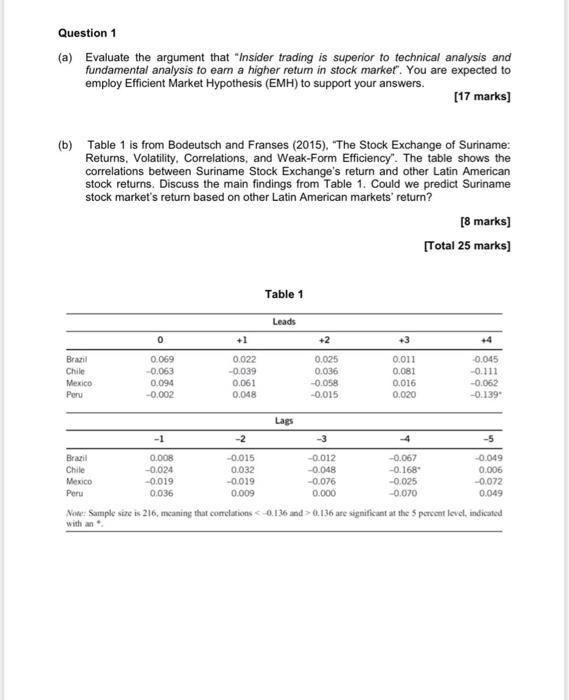
Question 1 (a) Evaluate the argument that "Insider trading is superior to technical analysis and fundamental analysis to earn a higher return in stock market". You are expected to employ Efficient Market Hypothesis (EMH) to support your answers. [17 marks) (b) Table 1 is from Bodeutsch and Franses (2015). "The Stock Exchange of Suriname: Returns, Volatility. Correlations, and Weak-Form Efficiency". The table shows the correlations between Suriname Stock Exchange's return and other Latin American stock returns. Discuss the main findings from Table 1. Could we predict Suriname stock market's return based on other Latin American markets' return? [8 marks] [Total 25 marks] Table 1 Leads 0 +1 +2 +3 Brazil Chile Mexico 0.069 -0.063 0.094 -0.002 0.022 -0.039 0,061 0.048 0.025 0.036 -0.058 -0.015 0.011 0.081 0.016 0.020 -0.045 -0.111 -0.062 -0.139 Peru Lags - 1 -2 -5 Brazil 0.008 -0.015 -0.012 -0.067 -0.049 Chile -0.024 0.032 -0.048 -0.168 0.006 Mexico -0.019 -0.019 -0.076 -0.025 -0.072 0.036 0.009 0.000 -0.070 0.049 Note Sample size is 216, meaning that conclations 0.136 are significant at the percent level, indicated with an Peru Question 1 (a) Evaluate the argument that "Insider trading is superior to technical analysis and fundamental analysis to earn a higher return in stock market". You are expected to employ Efficient Market Hypothesis (EMH) to support your answers. [17 marks) (b) Table 1 is from Bodeutsch and Franses (2015). "The Stock Exchange of Suriname: Returns, Volatility. Correlations, and Weak-Form Efficiency". The table shows the correlations between Suriname Stock Exchange's return and other Latin American stock returns. Discuss the main findings from Table 1. Could we predict Suriname stock market's return based on other Latin American markets' return? [8 marks] [Total 25 marks] Table 1 Leads 0 +1 +2 +3 Brazil Chile Mexico 0.069 -0.063 0.094 -0.002 0.022 -0.039 0,061 0.048 0.025 0.036 -0.058 -0.015 0.011 0.081 0.016 0.020 -0.045 -0.111 -0.062 -0.139 Peru Lags - 1 -2 -5 Brazil 0.008 -0.015 -0.012 -0.067 -0.049 Chile -0.024 0.032 -0.048 -0.168 0.006 Mexico -0.019 -0.019 -0.076 -0.025 -0.072 0.036 0.009 0.000 -0.070 0.049 Note Sample size is 216, meaning that conclations 0.136 are significant at the percent level, indicated with an Peru


