Answered step by step
Verified Expert Solution
Question
1 Approved Answer
please answer part c 1. In this question, we add uncertainty into the example economy from Question One on Assignment Two. Recall the description of


please answer part c
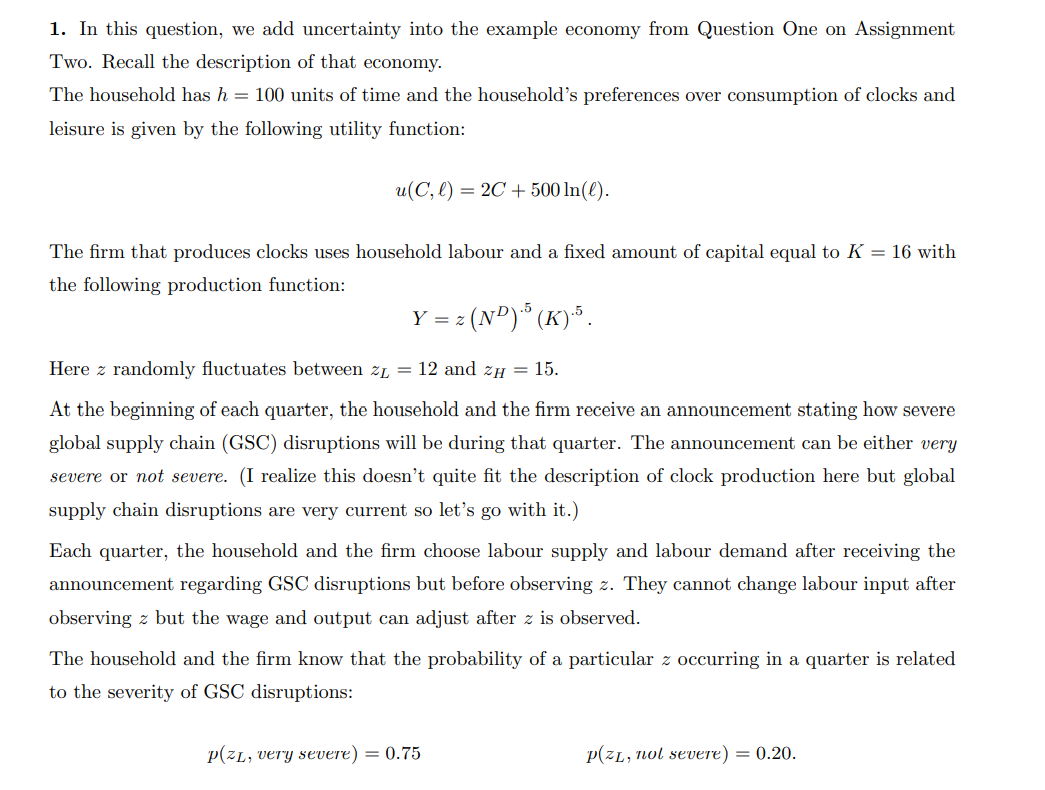
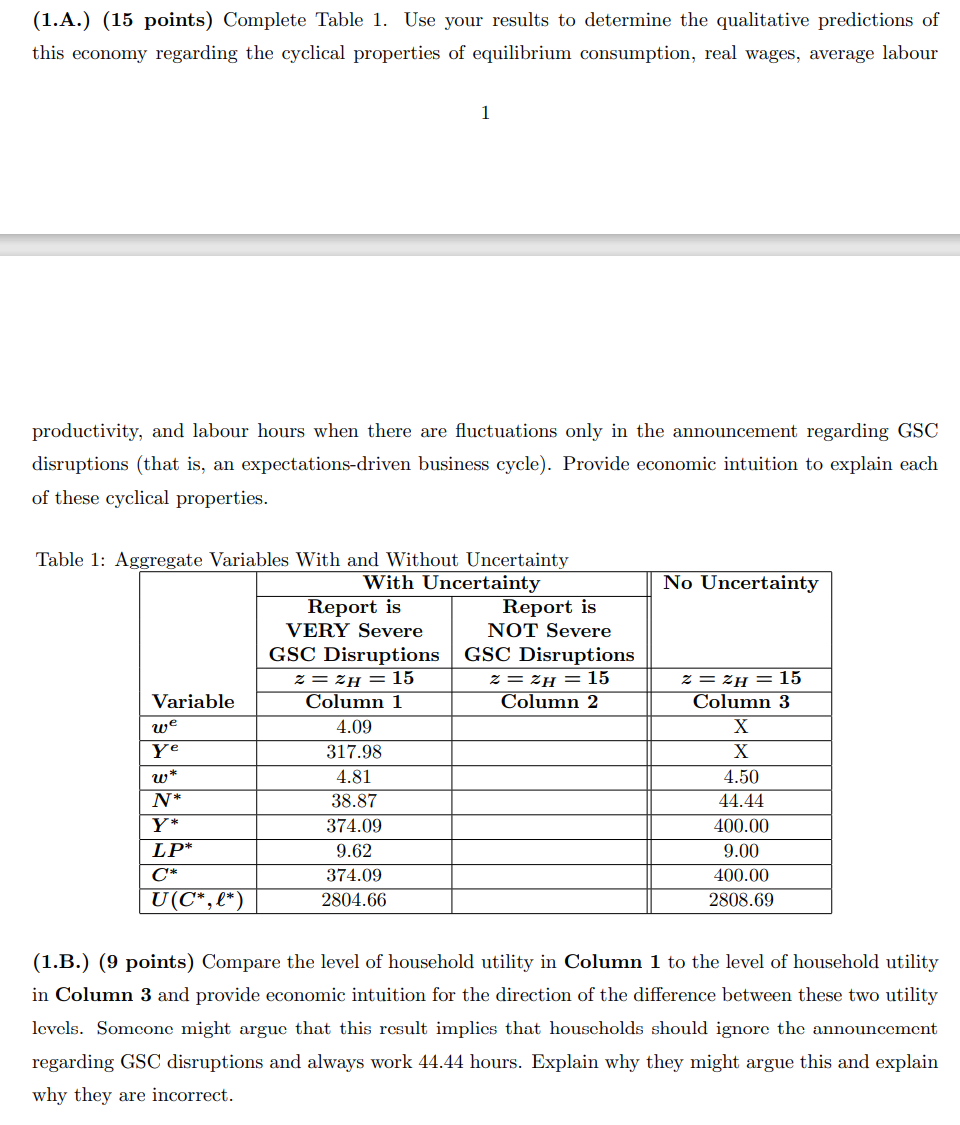
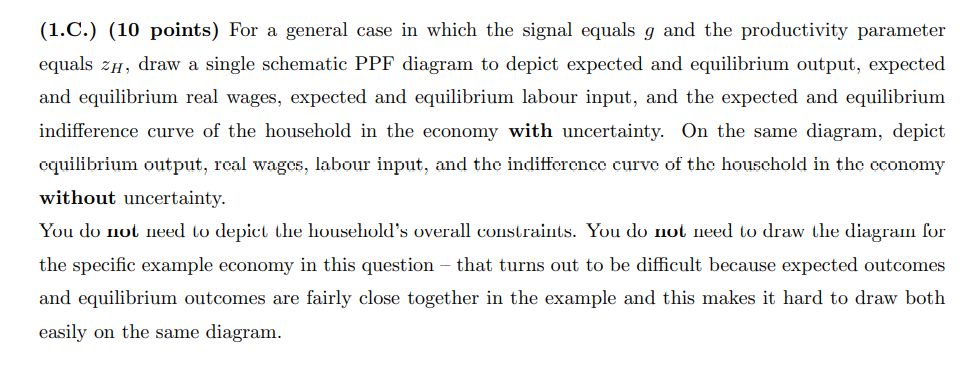
1. In this question, we add uncertainty into the example economy from Question One on Assignment Two. Recall the description of that economy. The household has h = 100 units of time and the household's preferences over consumption of clocks and leisure is given by the following utility function: u(Cl) = 2C + 500 ln(l). The firm that produces clocks uses household labour and a fixed amount of capital equal to K = 16 with the following production function: Ez (ND): (K)5. .5 Y = 2 Here z randomly fluctuates between zL = 12 and 2h = 15. At the beginning of each quarter, the household and the firm receive an announcement stating how severe global supply chain (GSC) disruptions will be during that quarter. The announcement can be either very severe or not severe. (I realize this doesn't quite fit the description of clock production here but global supply chain disruptions are very current so let's go with it.) Each quarter, the household and the firm choose labour supply and labour demand after receiving the announcement regarding GSC disruptions but before observing z. They cannot change labour input after observing z but the wage and output can adjust after z is observed. The household and the firm know that the probability of a particular z occurring in a quarter is related to the severity of GSC disruptions: P(ZL, very severe) = 0.75 P(ZL, not severe) = 0.20. (1.A.) (15 points) Complete Table 1. Use your results to determine the qualitative predictions of this economy regarding the cyclical properties of equilibrium consumption, real wages, average labour productivity, and labour hours when there are fluctuations only in the announcement regarding GSC disruptions (that is, an expectations-driven business cycle). Provide economic intuition to explain each of these cyclical properties. No Uncertainty Table 1: Aggregate Variables With and Without Uncertainty With Uncertainty Report is Report is VERY Severe NOT Severe GSC Disruptions GSC Disruptions 2= 2h = 15 2= ZH = 15 Variable Column 1 Column 2 we 4.09 Ye 317.98 w* 4.81 N* 38.87 Y* 374.09 LP* 9.62 374.09 U(C*,l*) 2804.66 2= ZH= 15 Column 3 X X 4.50 44.44 400.00 9.00 400.00 2808.69 (1.B.) (9 points) Compare the level of household utility in Column 1 to the level of household utility in Column 3 and provide economic intuition for the direction of the difference between these two utility levels. Someone might argue that this result implies that households should ignore the announcement regarding GSC disruptions and always work 44.44 hours. Explain why they might argue this and explain why they are incorrect. (1.C.) (10 points) For a general case in which the signal equals g and the productivity parameter equals zh, draw a single schematic PPF diagram to depict expected and equilibrium output, expected and equilibrium real wages, expected and equilibrium labour input, and the expected and equilibrium indifference curve of the household in the economy with uncertainty. On the same diagram, depict cquilibrium output, real wages, labour input, and the indifference curve of the houschold in the economy without uncertainty. You do not need to depict the household's overall constraints. You do not need to draw the diagram for the specific example economy in this question that turns out to be difficult because expected outcomes and equilibrium outcomes are fairly close together in the example and this makes it hard to draw both easily on the same diagram. 1. In this question, we add uncertainty into the example economy from Question One on Assignment Two. Recall the description of that economy. The household has h = 100 units of time and the household's preferences over consumption of clocks and leisure is given by the following utility function: u(Cl) = 2C + 500 ln(l). The firm that produces clocks uses household labour and a fixed amount of capital equal to K = 16 with the following production function: Ez (ND): (K)5. .5 Y = 2 Here z randomly fluctuates between zL = 12 and 2h = 15. At the beginning of each quarter, the household and the firm receive an announcement stating how severe global supply chain (GSC) disruptions will be during that quarter. The announcement can be either very severe or not severe. (I realize this doesn't quite fit the description of clock production here but global supply chain disruptions are very current so let's go with it.) Each quarter, the household and the firm choose labour supply and labour demand after receiving the announcement regarding GSC disruptions but before observing z. They cannot change labour input after observing z but the wage and output can adjust after z is observed. The household and the firm know that the probability of a particular z occurring in a quarter is related to the severity of GSC disruptions: P(ZL, very severe) = 0.75 P(ZL, not severe) = 0.20. (1.A.) (15 points) Complete Table 1. Use your results to determine the qualitative predictions of this economy regarding the cyclical properties of equilibrium consumption, real wages, average labour productivity, and labour hours when there are fluctuations only in the announcement regarding GSC disruptions (that is, an expectations-driven business cycle). Provide economic intuition to explain each of these cyclical properties. No Uncertainty Table 1: Aggregate Variables With and Without Uncertainty With Uncertainty Report is Report is VERY Severe NOT Severe GSC Disruptions GSC Disruptions 2= 2h = 15 2= ZH = 15 Variable Column 1 Column 2 we 4.09 Ye 317.98 w* 4.81 N* 38.87 Y* 374.09 LP* 9.62 374.09 U(C*,l*) 2804.66 2= ZH= 15 Column 3 X X 4.50 44.44 400.00 9.00 400.00 2808.69 (1.B.) (9 points) Compare the level of household utility in Column 1 to the level of household utility in Column 3 and provide economic intuition for the direction of the difference between these two utility levels. Someone might argue that this result implies that households should ignore the announcement regarding GSC disruptions and always work 44.44 hours. Explain why they might argue this and explain why they are incorrect. (1.C.) (10 points) For a general case in which the signal equals g and the productivity parameter equals zh, draw a single schematic PPF diagram to depict expected and equilibrium output, expected and equilibrium real wages, expected and equilibrium labour input, and the expected and equilibrium indifference curve of the household in the economy with uncertainty. On the same diagram, depict cquilibrium output, real wages, labour input, and the indifference curve of the houschold in the economy without uncertainty. You do not need to depict the household's overall constraints. You do not need to draw the diagram for the specific example economy in this question that turns out to be difficult because expected outcomes and equilibrium outcomes are fairly close together in the example and this makes it hard to draw both easily on the same diagramStep by Step Solution
There are 3 Steps involved in it
Step: 1

Get Instant Access to Expert-Tailored Solutions
See step-by-step solutions with expert insights and AI powered tools for academic success
Step: 2

Step: 3

Ace Your Homework with AI
Get the answers you need in no time with our AI-driven, step-by-step assistance
Get Started


