

Answered step by step
Verified Expert Solution
Question
1 Approved Answer
Please answer Q1.a QI. You have corrected historical quarterly data on U.S. one-yeae Treasury bond interest rate from 1957 and 2005, including total 193 observations,
Please answer Q1.a 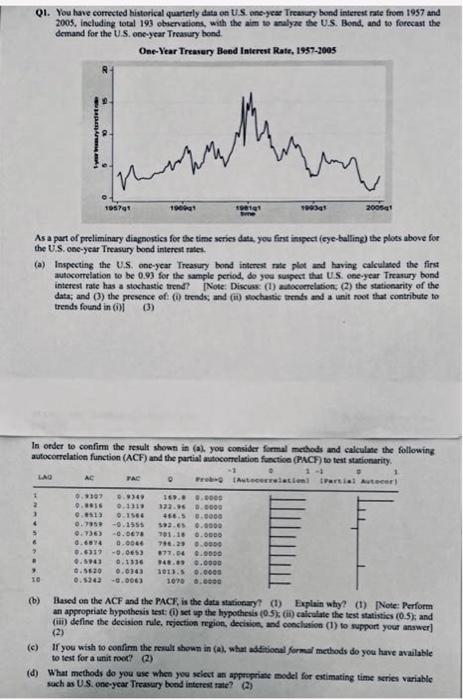
QI. You have corrected historical quarterly data on U.S. one-yeae Treasury bond interest rate from 1957 and 2005, including total 193 observations, with the aim to analyze the U.S. Bond, and to forecast the demand for the U.S. one-year Treasury hond One-Year Treasury Bund Interest Rate, 1997-2005 | shen enth www 195741 2011 1993 200041 As a part of preliminary diagnostics for the time series data. you first inspect (eye-balling the plots above for the U.S. one-year Treasury bond interest rates (a) Inspecting the U.S. one-year Treasury bond interest rate plot and having calculated the first autocorrelation to be 0.93 for the sample period, do you suspect that U.S. one-year Treasury bond interest rate has a stochastic trend? Note: Discuss (1) autocorrelation, (2) the stationarity of the data; and (3) the presence of: (i) trends, and (1) Mochastic trends and a unit root that contribute to trends found in (3) In order to confirm the result shown in (a). you consider formal methods and calculate the following autocorrelation function (ACF) and the partial autocorrelation function (PACto test stationarity -1 LAD AC TAC Arelation Partial Autor 1 0.9109 2.949 169.. 0.000 2 0.88 0.1319 33.96 0.0000 3 9.15 0:1160 456.5 0.0000 4 0.795 -9.1555 52.65 0.0000 2.736) -0.0678 301.18 0.000 6 0.6874 0.0000 746.29 0.000 0.6317 -0.0653 877.04 0.0000 0.1943 0.16 48.9 0.0000 0.560 0.0103 101.5 0.0000 10 -0.0063 10T0.6000 (b) Based on the ACF and the PACF, is the data stationary? (I) Explain why? (1) Note: Perform an appropriate hypothesis test :) set up the hypothesis (0.5%) calculate the test statistics (0.5), and (ii) define the decision rule, rejection region, decision, and conclusion (1) to support your answer (2) (c) If you wish to confirm the result shown in l. what additional form methods do you have available to test for a unit root? (2) (d) What methods do you use when you select an appropriate model for estimating time series variable such as U.S. one-year Treasury bond interest rate? (2) QI. You have corrected historical quarterly data on U.S. one-yeae Treasury bond interest rate from 1957 and 2005, including total 193 observations, with the aim to analyze the U.S. Bond, and to forecast the demand for the U.S. one-year Treasury hond One-Year Treasury Bund Interest Rate, 1997-2005 | shen enth www 195741 2011 1993 200041 As a part of preliminary diagnostics for the time series data. you first inspect (eye-balling the plots above for the U.S. one-year Treasury bond interest rates (a) Inspecting the U.S. one-year Treasury bond interest rate plot and having calculated the first autocorrelation to be 0.93 for the sample period, do you suspect that U.S. one-year Treasury bond interest rate has a stochastic trend? Note: Discuss (1) autocorrelation, (2) the stationarity of the data; and (3) the presence of: (i) trends, and (1) Mochastic trends and a unit root that contribute to trends found in (3) In order to confirm the result shown in (a). you consider formal methods and calculate the following autocorrelation function (ACF) and the partial autocorrelation function (PACto test stationarity -1 LAD AC TAC Arelation Partial Autor 1 0.9109 2.949 169.. 0.000 2 0.88 0.1319 33.96 0.0000 3 9.15 0:1160 456.5 0.0000 4 0.795 -9.1555 52.65 0.0000 2.736) -0.0678 301.18 0.000 6 0.6874 0.0000 746.29 0.000 0.6317 -0.0653 877.04 0.0000 0.1943 0.16 48.9 0.0000 0.560 0.0103 101.5 0.0000 10 -0.0063 10T0.6000 (b) Based on the ACF and the PACF, is the data stationary? (I) Explain why? (1) Note: Perform an appropriate hypothesis test :) set up the hypothesis (0.5%) calculate the test statistics (0.5), and (ii) define the decision rule, rejection region, decision, and conclusion (1) to support your answer (2) (c) If you wish to confirm the result shown in l. what additional form methods do you have available to test for a unit root? (2) (d) What methods do you use when you select an appropriate model for estimating time series variable such as U.S. one-year Treasury bond interest rate? (2) Step by Step Solution
There are 3 Steps involved in it
Step: 1

Get Instant Access to Expert-Tailored Solutions
See step-by-step solutions with expert insights and AI powered tools for academic success
Step: 2

Step: 3
Ace Your Homework with AI
Get the answers you need in no time with our AI-driven, step-by-step assistance
Get Started
Finance For Housing An Introduction
Authors: Cathy Davis
1st Edition
1447306481, 978-1447306481