

Answered step by step
Verified Expert Solution
Question
1 Approved Answer
please answer question 2 b through e thank you ons and the less-tolerant position on B. Suppose a respondent takes the more-tolerant position on two
please answer question 2 b through e thank you 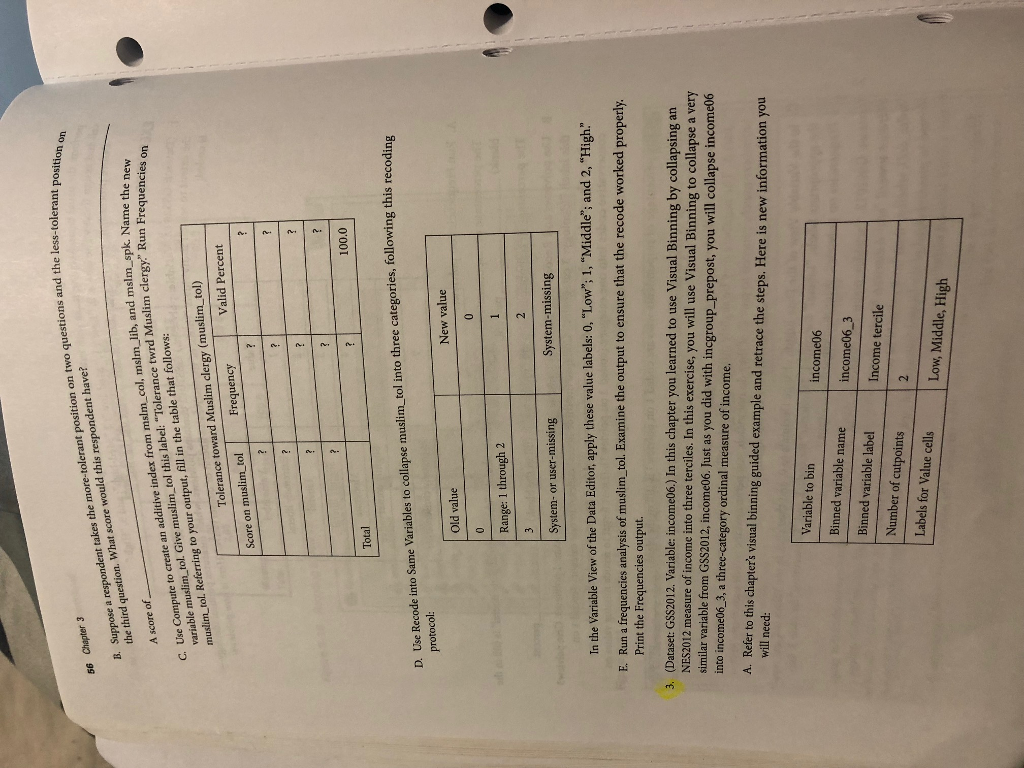
ons and the less-tolerant position on B. Suppose a respondent takes the more-tolerant position on two the third question. What score would this respondent have? 56 Chapter 3 C. Use Compute to create an additive index from msim, col. mslm-lib, variable muslim tol. Give muslim tol this label: "Tolerance twrd musim tol., Referring to your output, fill in the table that follows score of e twrd Muslim clergy" Run Frequencies on Tolerance toward Muslim clergy (muslim_ tol) Frequency Valid Percent tol Score on muslim 100.0 Total D. Use Recode into Same Variables to collapse muslim_ tol into three categories, following this New value Old value Range: 1 through 2 System- or user-missing System-missing able View of the Data Editor, apply these value labels: 0, "Low"; 1, "Middle'; and 2, "High." F. Run a frequencies analysis of muslim_tol. Examine the output to ensure that the recode worked properly Print the Frequencies output. (Dataset: GSS2012. Variable: income06.) In this chapter you learned to use Visual Binning by collapsing an NES2012 measure of income into three terciles. In this exercise, you will use Visual Binning to collapse a very similar variable from GS$2012, income06. Just as you did with incgroup_prepost, you will collapse income06 3, into income06_3, a three-category ordinal measure of income. A. Refer to this chapter's visual binning guided example and retrace the steps. Here is new information you will need: Variable to bin Binned variable name Binned variable label Number of cutpoints Labels for Value cellsLow, Middle, High income06 income063 Income tercile ons and the less-tolerant position on B. Suppose a respondent takes the more-tolerant position on two the third question. What score would this respondent have? 56 Chapter 3 C. Use Compute to create an additive index from msim, col. mslm-lib, variable muslim tol. Give muslim tol this label: "Tolerance twrd musim tol., Referring to your output, fill in the table that follows score of e twrd Muslim clergy" Run Frequencies on Tolerance toward Muslim clergy (muslim_ tol) Frequency Valid Percent tol Score on muslim 100.0 Total D. Use Recode into Same Variables to collapse muslim_ tol into three categories, following this New value Old value Range: 1 through 2 System- or user-missing System-missing able View of the Data Editor, apply these value labels: 0, "Low"; 1, "Middle'; and 2, "High." F. Run a frequencies analysis of muslim_tol. Examine the output to ensure that the recode worked properly Print the Frequencies output. (Dataset: GSS2012. Variable: income06.) In this chapter you learned to use Visual Binning by collapsing an NES2012 measure of income into three terciles. In this exercise, you will use Visual Binning to collapse a very similar variable from GS$2012, income06. Just as you did with incgroup_prepost, you will collapse income06 3, into income06_3, a three-category ordinal measure of income. A. Refer to this chapter's visual binning guided example and retrace the steps. Here is new information you will need: Variable to bin Binned variable name Binned variable label Number of cutpoints Labels for Value cellsLow, Middle, High income06 income063 Income tercile
Step by Step Solution
There are 3 Steps involved in it
Step: 1

Get Instant Access to Expert-Tailored Solutions
See step-by-step solutions with expert insights and AI powered tools for academic success
Step: 2

Step: 3
Ace Your Homework with AI
Get the answers you need in no time with our AI-driven, step-by-step assistance
Get Started
Oracle Database Foundations Technology Fundamentals For IT Success
Authors: Bob Bryla
1st Edition
0782143725, 9780782143720