Answered step by step
Verified Expert Solution
Link Copied!

Question

1 Approved Answer

Please answer question 3 and 4 using the instructions at the top of this question sheet. Please show full workout Math Analysis Name ID: I

Please answer question 3 and 4 using the instructions at the top of this question sheet. Please show full workout
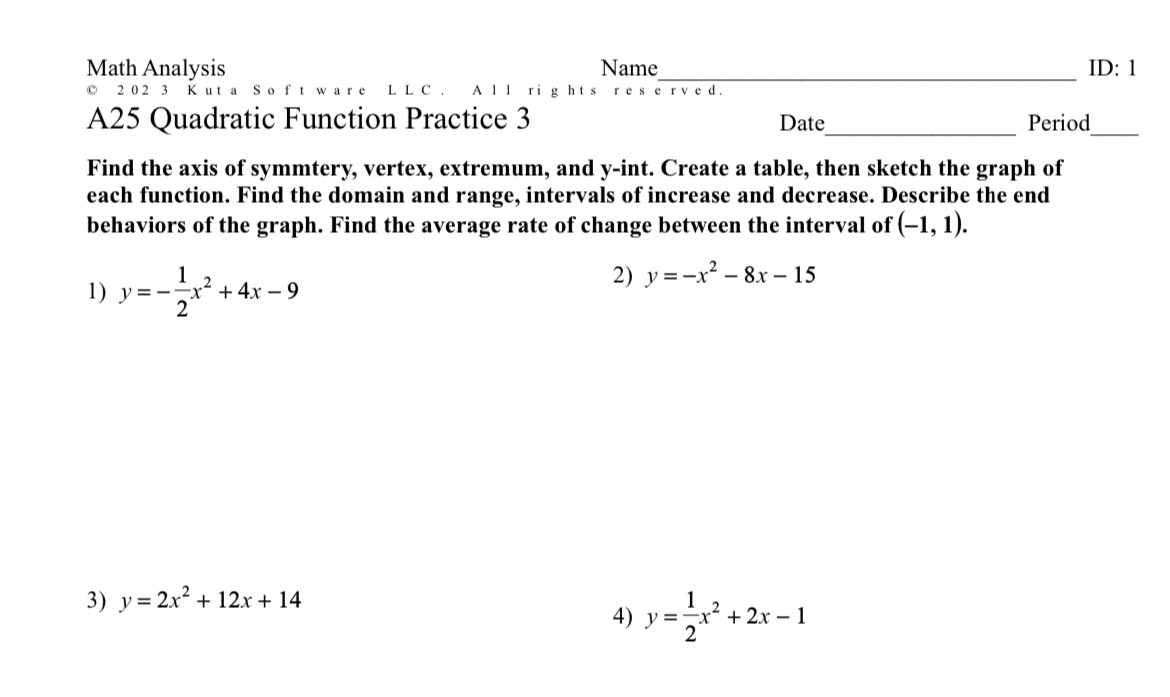
image text in transcribed
Math Analysis Name ID: I -l'- 2023 Kutu Hul'twnru |.|.('. All rights: reserved. A25 Quadratic Function Practice 3 Date Period Find the axis of symmtery, vertex, extremum, and y-int. Create a table, then sketch the graph of each function. Find the domain and range, intervals of increase and decrease. Describe the end behaviors of the graph. Find the average rate of change between the interval of (1, l). 1 2)y=x28x15 l =2+4 9 )y 2x x 3) y=2x2+ le+ 14

Step by Step Solution

There are 3 Steps involved in it

Step: 1

blur-text-image

Get Instant Access to Expert-Tailored Solutions

See step-by-step solutions with expert insights and AI powered tools for academic success

Step: 2

blur-text-image

Step: 3

blur-text-image

Ace Your Homework with AI

Get the answers you need in no time with our AI-driven, step-by-step assistance

Get Started

Recommended Textbook for

Complex Variables and Applications

Authors: James Brown, Ruel Churchill

8th edition

73051942, 978-0073051949

More Books

Students also viewed these Mathematics questions

Question

Determine your purpose.

Answered: 1 week ago