Please Answer Question 8


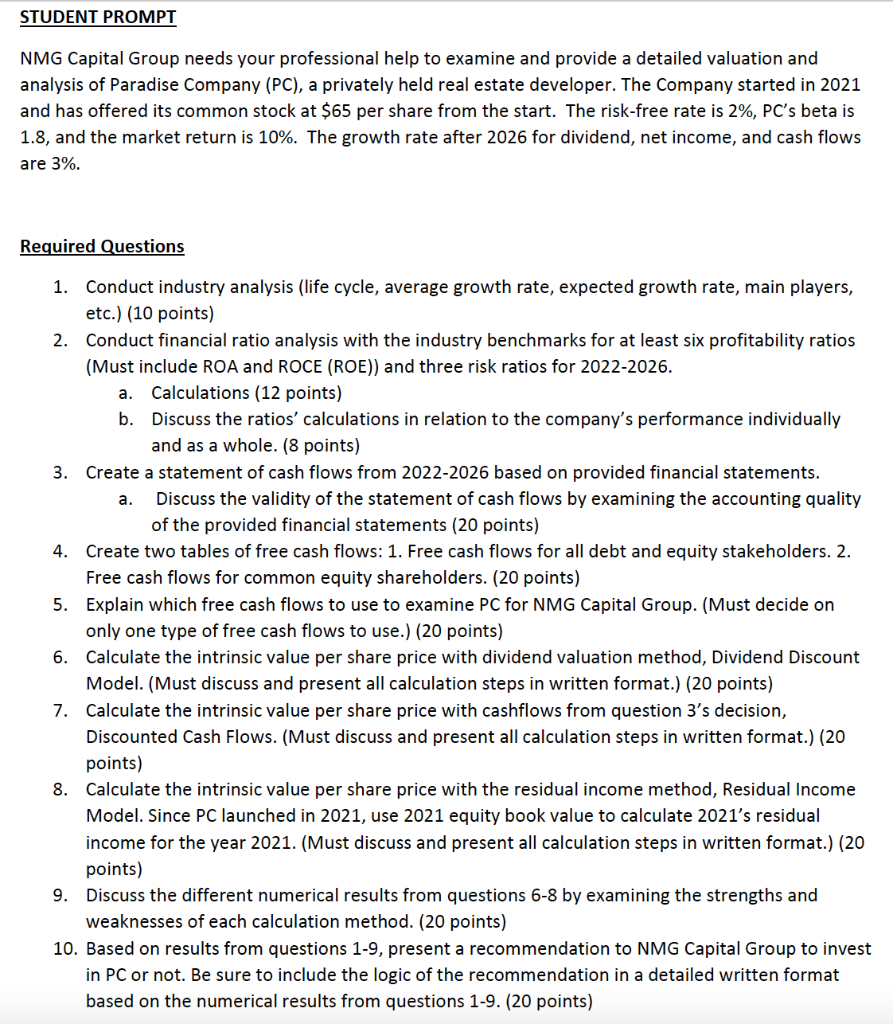
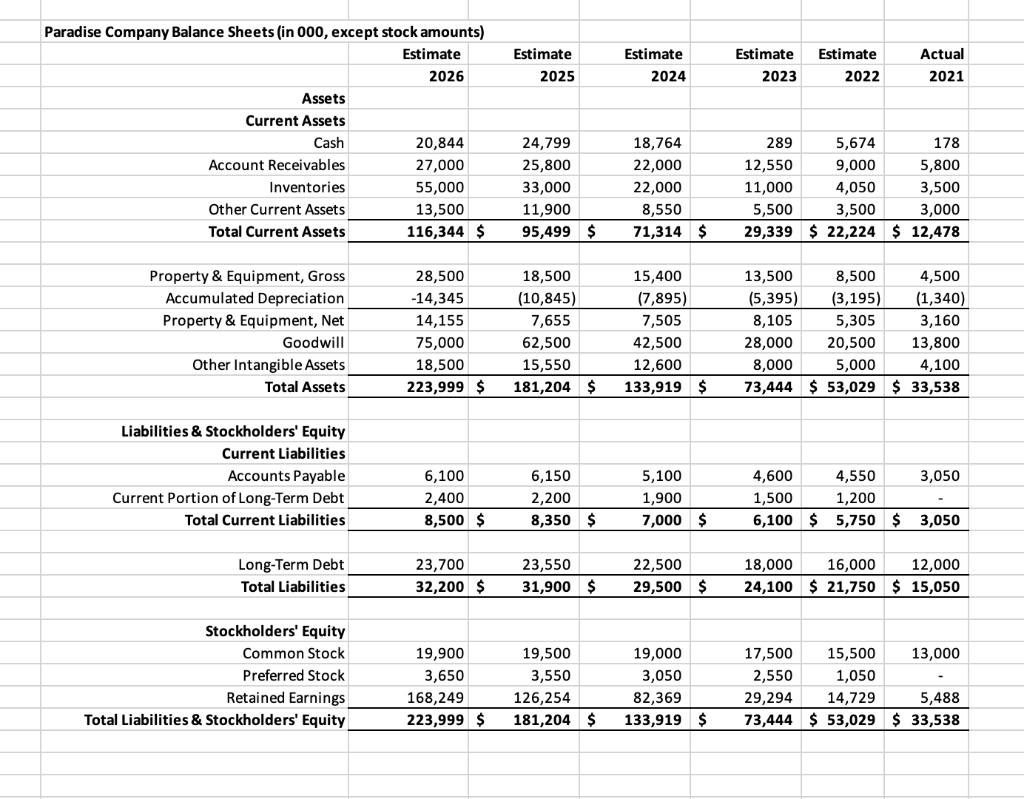
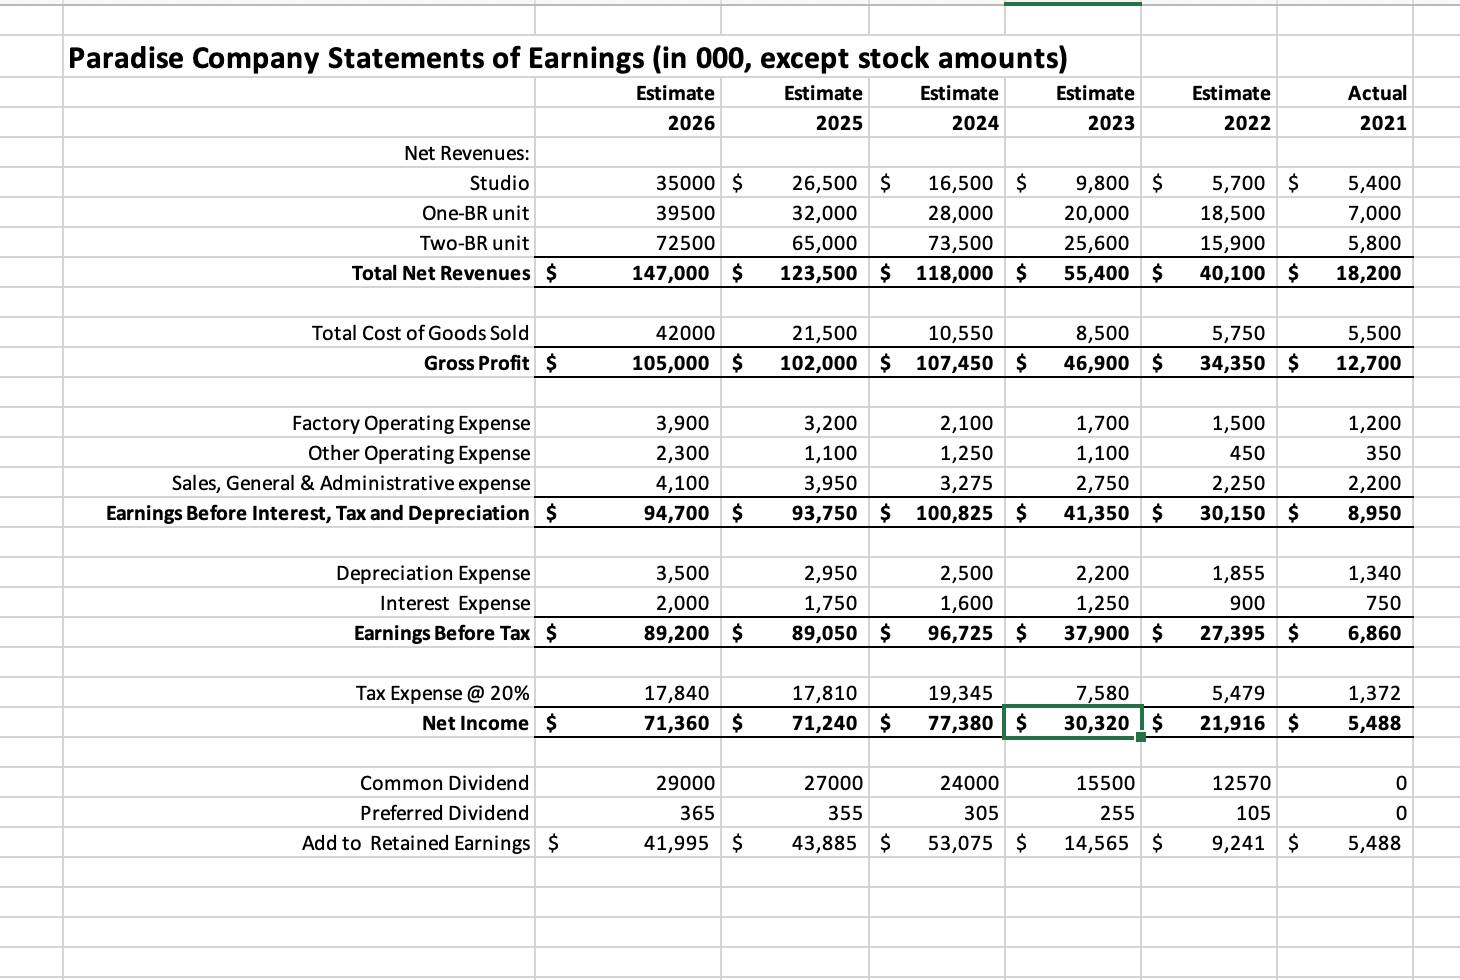
STUDENT PROMPT NMG Capital Group needs your professional help to examine and provide a detailed valuation and analysis of Paradise Company (PC), a privately held real estate developer. The Company started in 2021 and has offered its common stock at $65 per share from the start. The risk-free rate is 2%, PC's beta is 1.8, and the market return is 10%. The growth rate after 2026 for dividend, net income, and cash flows are 3%. Required Questions a. a. 1. Conduct industry analysis (life cycle, average growth rate, expected growth rate, main players, etc.) (10 points) 2. Conduct financial ratio analysis with the industry benchmarks for at least six profitability ratios (Must include ROA and ROCE (ROE)) and three risk ratios for 2022-2026. Calculations (12 points) b. Discuss the ratios' calculations in relation to the company's performance individually and as a whole. (8 points) 3. Create a statement of cash flows from 2022-2026 based on provided financial statements. Discuss the validity of the statement of cash flows by examining the accounting quality of the provided financial statements (20 points) 4. Create two tables of free cash flows: 1. Free cash flows for all debt and equity stakeholders. 2. Free cash flows for common equity shareholders. (20 points) 5. Explain which free cash flows to use to examine PC for NMG Capital Group. (Must decide on only one type of free cash flows to use.) (20 points) 6. Calculate the intrinsic value per share price with dividend valuation method, Dividend Discount Model. (Must discuss and present all calculation steps in written format.) (20 points) 7. Calculate the intrinsic value per share price with cashflows from question 3's decision, Discounted Cash Flows. (Must discuss and present all calculation steps in written format.) (20 points) 8. Calculate the intrinsic value per share price with the residual income method, Residual Income Model. Since PC launched in 2021, use 2021 equity book value to calculate 2021's residual income for the year 2021. (Must discuss and present all calculation steps in written format.) (20 points) Discuss the different numerical results from questions 6-8 by examining the strengths and weaknesses of each calculation method. (20 points) 10. Based on results from questions 1-9, present a recommendation to NMG Capital Group to invest in PC or not. Be sure to include the logic of the recommendation in a detailed written format based on the numerical results from questions 1-9. (20 points) 9. Estimate 2025 Estimate 2024 Estimate 2023 Estimate 2022 Actual 2021 Paradise Company Balance Sheets (in 000, except stock amounts) Estimate 2026 Assets Current Assets Cash 20,844 Account Receivables 27,000 Inventories 55,000 Other Current Assets 13,500 Total Current Assets 116,344 $ 24,799 25,800 33,000 11,900 95,499 $ 18,764 22,000 22,000 8,550 71,314 $ 289 5,674 178 12,550 9,000 5,800 11,000 4,050 3,500 5,500 3,500 3,000 29,339 $ 22,224 $ 12,478 Property & Equipment, Gross Accumulated Depreciation Property & Equipment, Net Goodwill Other Intangible Assets Total Assets 28,500 -14,345 14,155 75,000 18,500 223,999 $ 18,500 (10,845) 7,655 62,500 15,550 181,204 $ 15,400 (7,895) 7,505 42,500 12,600 133,919 $ 13,500 8,500 4,500 (5,395) (3,195) (1,340) 8,105 5,305 3,160 28,000 20,500 13,800 8,000 5,000 4,100 73,444 $ 53,029 $ 33,538 Liabilities & Stockholders' Equity Current Liabilities Accounts Payable Current Portion of Long-Term Debt Total Current Liabilities 6,100 2,400 8,500 $ 6,150 2,200 8,350 $ 5,100 1,900 7,000 $ 4,600 4,550 3,050 1,500 1,200 6,100 $ 5,750 $ 3,050 Long-Term Debt Total Liabilities 23,700 32,200 $ 23,550 31,900 $ 22,500 29,500 $ 18,000 16,000 12,000 24,100 $ 21,750 $ 15,050 Stockholders' Equity Common Stock Preferred Stock Retained Earnings Total Liabilities & Stockholders' Equity 19,900 3,650 168,249 223,999 $ 19,500 3,550 126,254 181,204 $ 19,000 3,050 82,369 133,919 $ 17,500 15,500 13,000 2,550 1,050 29,294 14,729 5,488 73,444 $ 53,029 $ 33,538 Paradise Company Statements of Earnings (in 000, except stock amounts) Estimate Estimate Estimate Estimate Estimate 2025 Actual 2021 2026 2024 2023 2022 Net Revenues: Studio One-BR unit TWO-BR unit Total Net Revenues $ 35000 $ 39500 72500 147,000 $ 26,500 $ 32,000 65,000 123,500 $ 16,500 $ 28,000 73,500 118,000 $ 9,800 $ 20,000 25,600 55,400 $ 5,700 $ 18,500 15,900 40,100 $ 5,400 7,000 5,800 18,200 8,500 Total Cost of Goods Sold Gross Profit $ 42000 105,000 $ 21,500 102,000 $ 10,550 107,450 $ 5,750 34,350 $ 5,500 12,700 46,900 $ Factory Operating Expense Other Operating Expense Sales, General & Administrative expense Earnings Before Interest, Tax and Depreciation $ 3,900 2,300 4,100 94,700 $ 3,200 1,100 3,950 93,750 $ 2,100 1,250 3,275 100,825 $ 1,700 1,100 2,750 41,350 $ 1,500 450 2,250 30,150 $ 1,200 350 2,200 8,950 Depreciation Expense Interest Expense Earnings Before Tax $ 3,500 2,000 89,200 $ 2,950 1,750 89,050 $ 2,500 1,600 96,725 $ 2,200 1,250 37,900 $ 1,855 900 27,395 $ 1,340 750 6,860 Tax Expense @ 20% Net Income $ 17,840 71,360 $ 17,810 71,240 $ 19,345 77,380 $ 7,580 30,320$ 5,479 21,916 $ 1,372 5,488 0 Common Dividend Preferred Dividend Add to Retained Earnings $ 29000 365 41,995 $ 27000 355 43,885 $ 24000 305 53,075 $ 15500 255 14,565 $ 12570 105 9,241 $ 0 5,488 STUDENT PROMPT NMG Capital Group needs your professional help to examine and provide a detailed valuation and analysis of Paradise Company (PC), a privately held real estate developer. The Company started in 2021 and has offered its common stock at $65 per share from the start. The risk-free rate is 2%, PC's beta is 1.8, and the market return is 10%. The growth rate after 2026 for dividend, net income, and cash flows are 3%. Required Questions a. a. 1. Conduct industry analysis (life cycle, average growth rate, expected growth rate, main players, etc.) (10 points) 2. Conduct financial ratio analysis with the industry benchmarks for at least six profitability ratios (Must include ROA and ROCE (ROE)) and three risk ratios for 2022-2026. Calculations (12 points) b. Discuss the ratios' calculations in relation to the company's performance individually and as a whole. (8 points) 3. Create a statement of cash flows from 2022-2026 based on provided financial statements. Discuss the validity of the statement of cash flows by examining the accounting quality of the provided financial statements (20 points) 4. Create two tables of free cash flows: 1. Free cash flows for all debt and equity stakeholders. 2. Free cash flows for common equity shareholders. (20 points) 5. Explain which free cash flows to use to examine PC for NMG Capital Group. (Must decide on only one type of free cash flows to use.) (20 points) 6. Calculate the intrinsic value per share price with dividend valuation method, Dividend Discount Model. (Must discuss and present all calculation steps in written format.) (20 points) 7. Calculate the intrinsic value per share price with cashflows from question 3's decision, Discounted Cash Flows. (Must discuss and present all calculation steps in written format.) (20 points) 8. Calculate the intrinsic value per share price with the residual income method, Residual Income Model. Since PC launched in 2021, use 2021 equity book value to calculate 2021's residual income for the year 2021. (Must discuss and present all calculation steps in written format.) (20 points) Discuss the different numerical results from questions 6-8 by examining the strengths and weaknesses of each calculation method. (20 points) 10. Based on results from questions 1-9, present a recommendation to NMG Capital Group to invest in PC or not. Be sure to include the logic of the recommendation in a detailed written format based on the numerical results from questions 1-9. (20 points) 9. Estimate 2025 Estimate 2024 Estimate 2023 Estimate 2022 Actual 2021 Paradise Company Balance Sheets (in 000, except stock amounts) Estimate 2026 Assets Current Assets Cash 20,844 Account Receivables 27,000 Inventories 55,000 Other Current Assets 13,500 Total Current Assets 116,344 $ 24,799 25,800 33,000 11,900 95,499 $ 18,764 22,000 22,000 8,550 71,314 $ 289 5,674 178 12,550 9,000 5,800 11,000 4,050 3,500 5,500 3,500 3,000 29,339 $ 22,224 $ 12,478 Property & Equipment, Gross Accumulated Depreciation Property & Equipment, Net Goodwill Other Intangible Assets Total Assets 28,500 -14,345 14,155 75,000 18,500 223,999 $ 18,500 (10,845) 7,655 62,500 15,550 181,204 $ 15,400 (7,895) 7,505 42,500 12,600 133,919 $ 13,500 8,500 4,500 (5,395) (3,195) (1,340) 8,105 5,305 3,160 28,000 20,500 13,800 8,000 5,000 4,100 73,444 $ 53,029 $ 33,538 Liabilities & Stockholders' Equity Current Liabilities Accounts Payable Current Portion of Long-Term Debt Total Current Liabilities 6,100 2,400 8,500 $ 6,150 2,200 8,350 $ 5,100 1,900 7,000 $ 4,600 4,550 3,050 1,500 1,200 6,100 $ 5,750 $ 3,050 Long-Term Debt Total Liabilities 23,700 32,200 $ 23,550 31,900 $ 22,500 29,500 $ 18,000 16,000 12,000 24,100 $ 21,750 $ 15,050 Stockholders' Equity Common Stock Preferred Stock Retained Earnings Total Liabilities & Stockholders' Equity 19,900 3,650 168,249 223,999 $ 19,500 3,550 126,254 181,204 $ 19,000 3,050 82,369 133,919 $ 17,500 15,500 13,000 2,550 1,050 29,294 14,729 5,488 73,444 $ 53,029 $ 33,538 Paradise Company Statements of Earnings (in 000, except stock amounts) Estimate Estimate Estimate Estimate Estimate 2025 Actual 2021 2026 2024 2023 2022 Net Revenues: Studio One-BR unit TWO-BR unit Total Net Revenues $ 35000 $ 39500 72500 147,000 $ 26,500 $ 32,000 65,000 123,500 $ 16,500 $ 28,000 73,500 118,000 $ 9,800 $ 20,000 25,600 55,400 $ 5,700 $ 18,500 15,900 40,100 $ 5,400 7,000 5,800 18,200 8,500 Total Cost of Goods Sold Gross Profit $ 42000 105,000 $ 21,500 102,000 $ 10,550 107,450 $ 5,750 34,350 $ 5,500 12,700 46,900 $ Factory Operating Expense Other Operating Expense Sales, General & Administrative expense Earnings Before Interest, Tax and Depreciation $ 3,900 2,300 4,100 94,700 $ 3,200 1,100 3,950 93,750 $ 2,100 1,250 3,275 100,825 $ 1,700 1,100 2,750 41,350 $ 1,500 450 2,250 30,150 $ 1,200 350 2,200 8,950 Depreciation Expense Interest Expense Earnings Before Tax $ 3,500 2,000 89,200 $ 2,950 1,750 89,050 $ 2,500 1,600 96,725 $ 2,200 1,250 37,900 $ 1,855 900 27,395 $ 1,340 750 6,860 Tax Expense @ 20% Net Income $ 17,840 71,360 $ 17,810 71,240 $ 19,345 77,380 $ 7,580 30,320$ 5,479 21,916 $ 1,372 5,488 0 Common Dividend Preferred Dividend Add to Retained Earnings $ 29000 365 41,995 $ 27000 355 43,885 $ 24000 305 53,075 $ 15500 255 14,565 $ 12570 105 9,241 $ 0 5,488


