

Please answer Questions d and e. Thank you. Discussion Question The table below shows monthly data collected on production costs and on the number of
Please answer Questions d and e. Thank you.
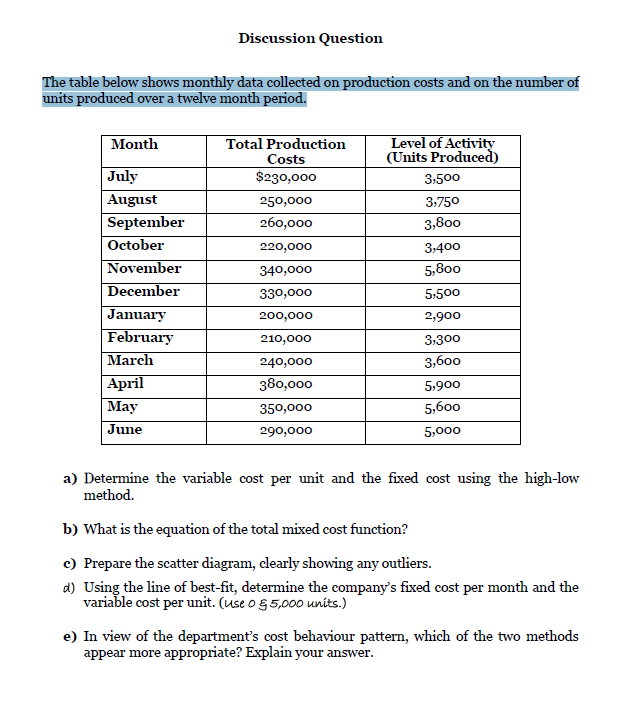
Discussion Question The table below shows monthly data collected on production costs and on the number of units produced over a twelve month period. Month Total Production Costs $230,000 250,000 260,000 220,000 340,000 330,000 July August September October November December January February March April May June Level of Activity (Units Produced) 3,500 3,750 3,800 3,400 5,800 5,500 2,900 3,300 3,600 5,900 5,600 5,000 200,000 210,000 240,000 380,000 350,000 290,000 a) Determine the variable cost per unit and the fixed cost using the high-low method. b) What is the equation of the total mixed cost function? c) Prepare the scatter diagram, clearly showing any outliers. d) Using the line of best-fit, determine the company's fixed cost per month and the variable cost per unit. (use o g 5,000 units.) e) In view of the department's cost behaviour pattern, which of the two methods appear more appropriate? Explain yourStep by Step Solution
There are 3 Steps involved in it
Step: 1

Get step-by-step solutions from verified subject matter experts
100% Satisfaction Guaranteed-or Get a Refund!
Step: 2Unlock detailed examples and clear explanations to master concepts

Step: 3Unlock to practice, ask and learn with real-world examples
See step-by-step solutions with expert insights and AI powered tools for academic success
-
 Access 30 Million+ textbook solutions.
-
Ask unlimited questions from AI Tutors.
-
Order free textbooks.
-
100% Satisfaction Guaranteed-or Get a Refund!
Claim Your Hoodie Now!

Authors: Langdon Morris
1st Edition
B08HBBKKPJ, 979-8682091614

Study Smart with AI Flashcards
Access a vast library of flashcards, create your own, and experience a game-changing transformation in how you learn and retain knowledge
Explore Flashcards

