Please answer the following below!
b
c
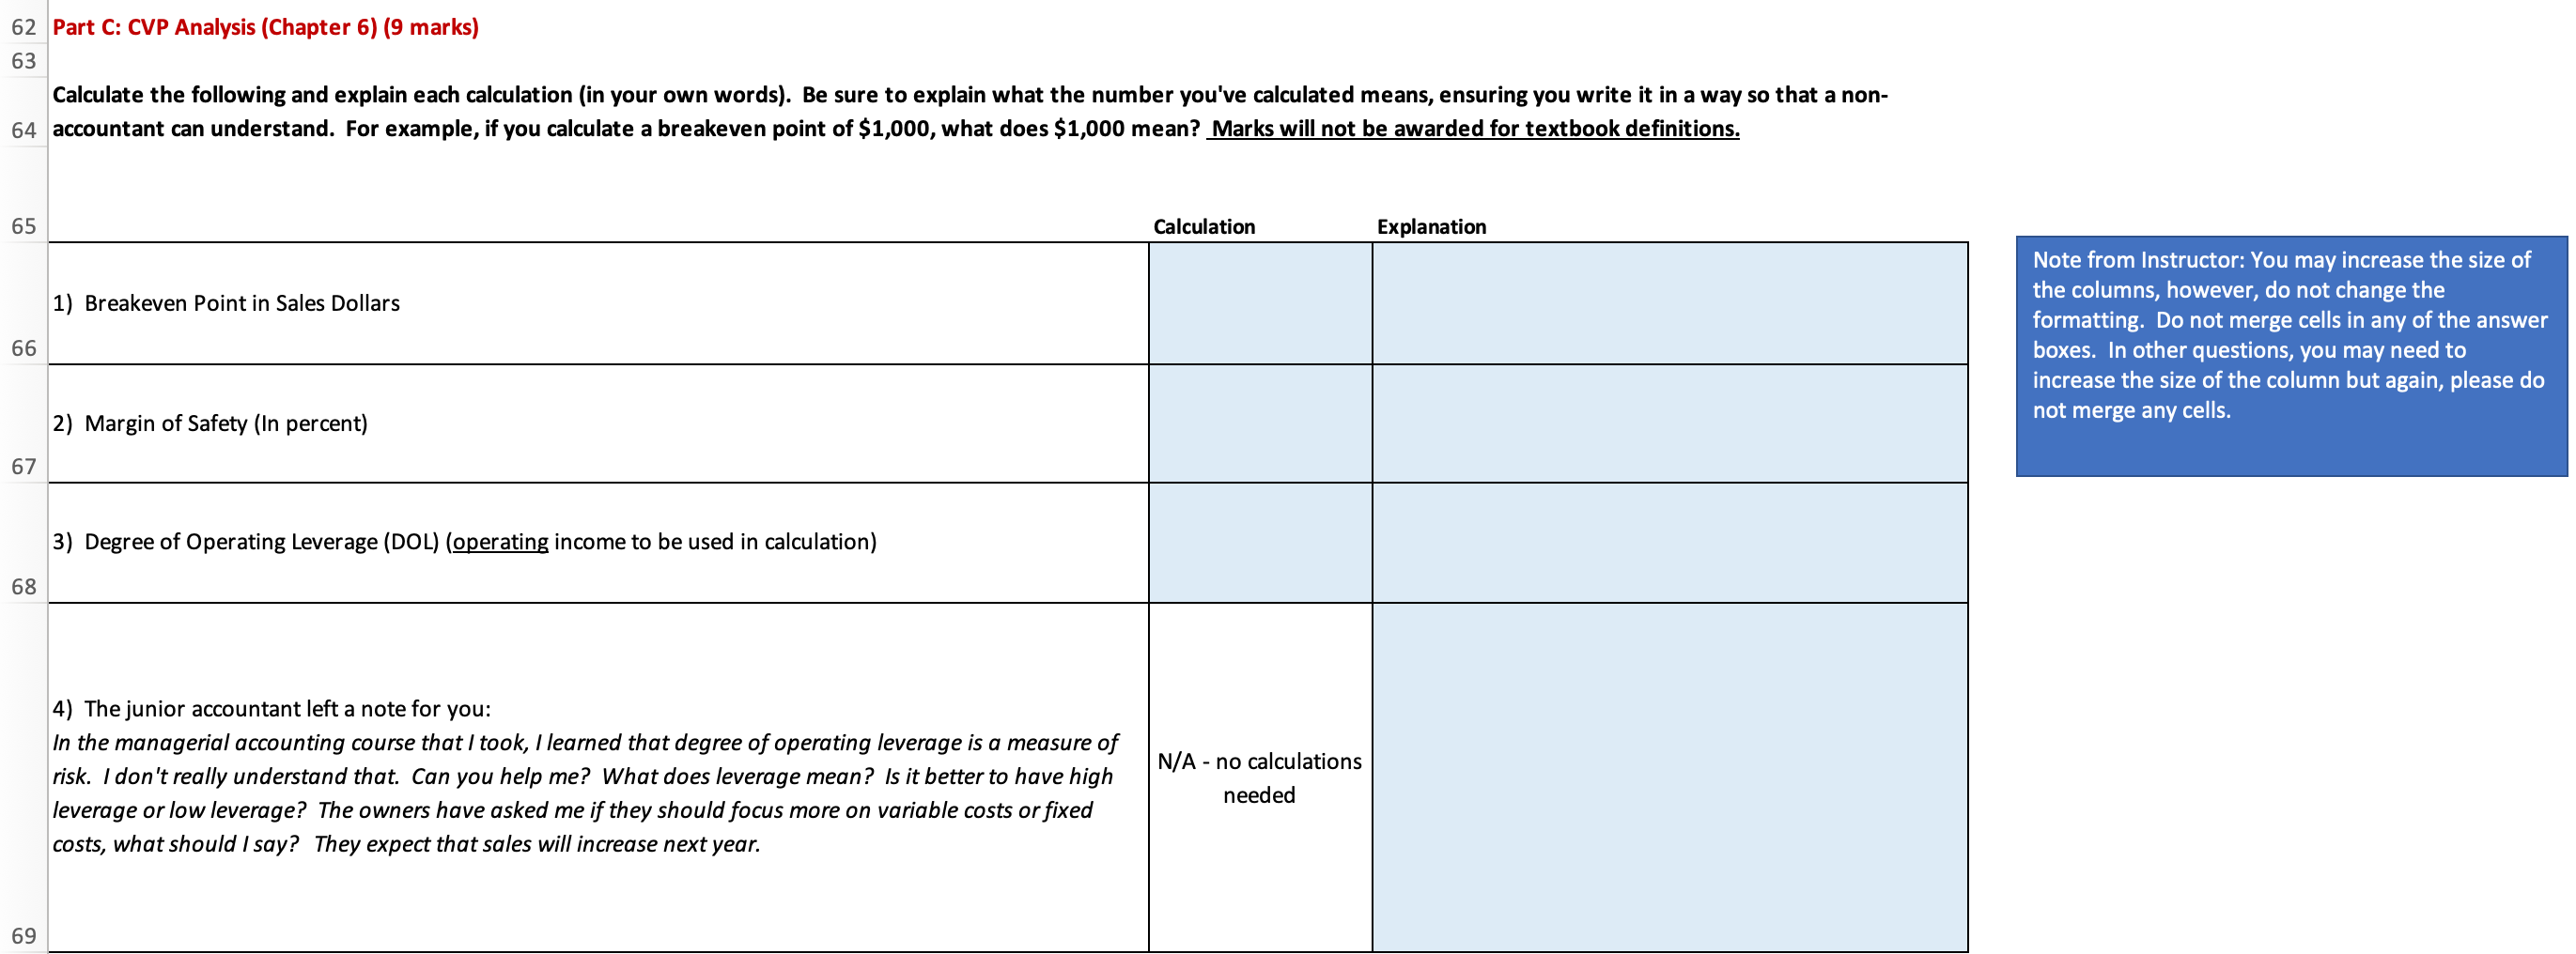
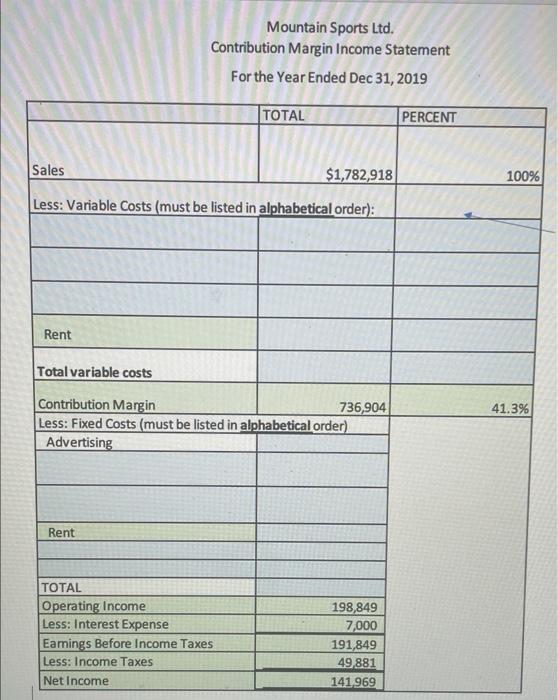
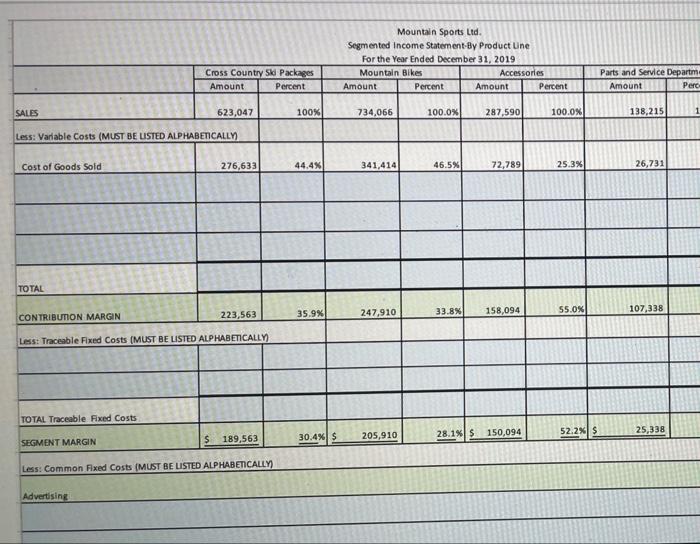
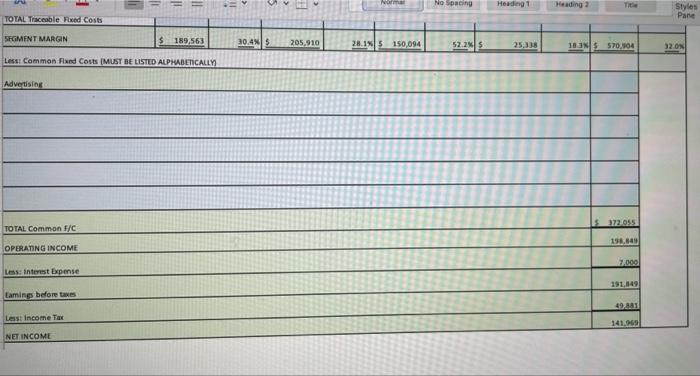
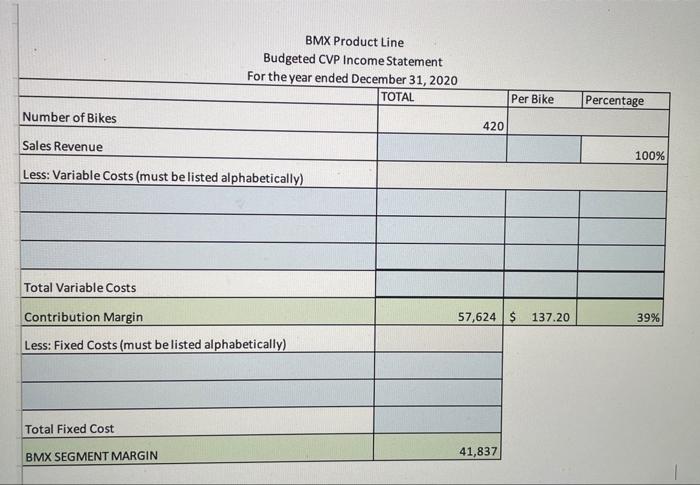
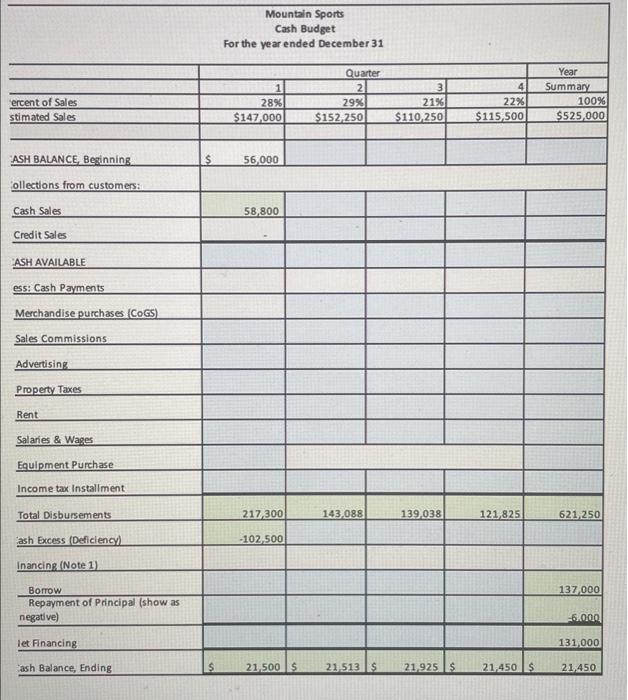
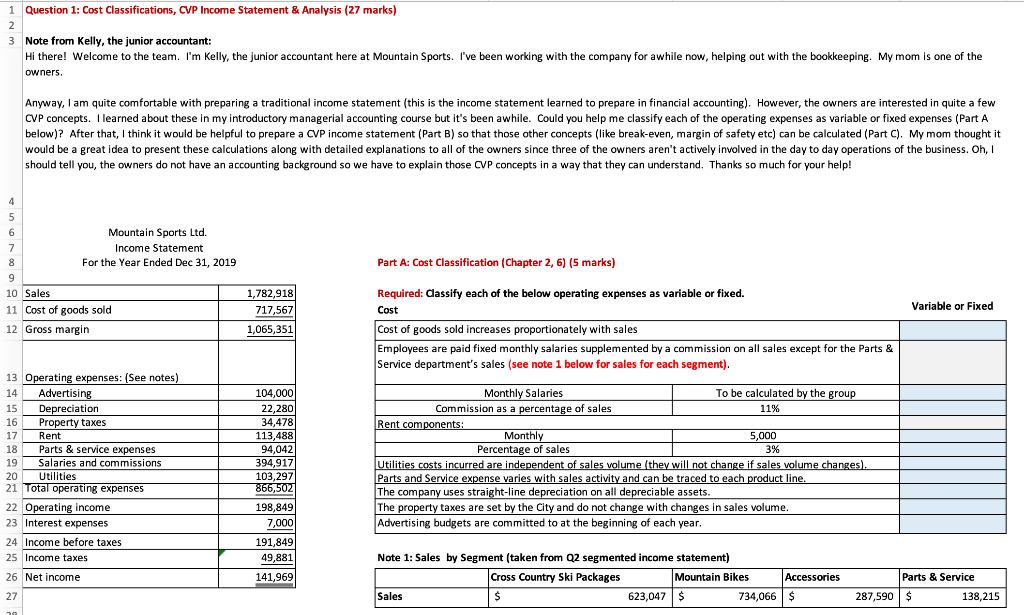
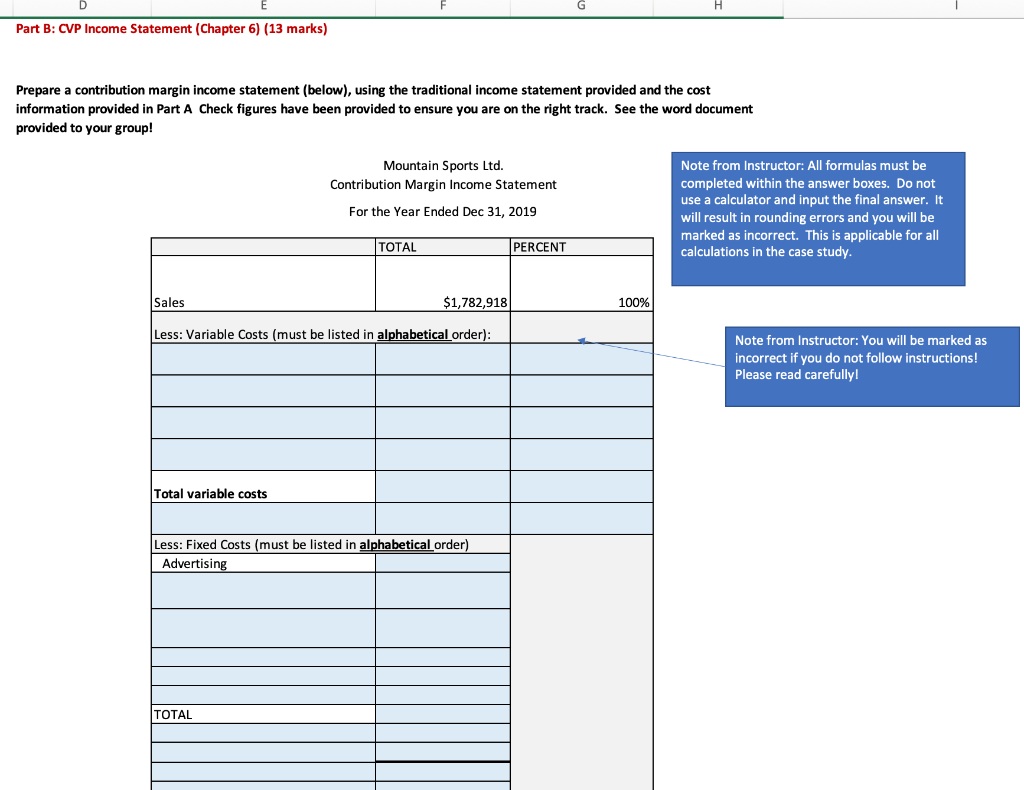
1 Question 1: Cost Classifications, CVP Income Statement & Analysis (27 marks) 2 3 Note from Kelly, the junior accountant: Hi there! Welcome to the team. I'm Kelly, the junior accountant here at Mountain Sports. I've been working with the company for awhile now, helping out with the bookkeeping. My mom is one of the owners. Anyway, I am quite comfortable with preparing a traditional income statement (this is the income statement learned to prepare in financial accounting). However, the owners are interested in quite a few CVP concepts. I learned about these in my introductory managerial accounting course but it's been awhile. Could you help me classify each of the operating expenses as variable or fixed expenses (Part A below)? After that, I think it would be helpful to prepare a CVP income statement (Part B) so that those other concepts (like break-even, margin of safety etc) can be calculated (Part C). My mom thought it would be a great idea present these calculations along with detailed explanations to all of the owners since three of the owners aren't actively involved in the day to day operations of the business. Oh, I should tell you, the owners do not have an accounting background so we have to explain those CVP concepts in a way that they can understand. Thanks so much for your help! 4 5 6 Mountain Sports Ltd. 7 Income Statement 8 For the Year Ended Dec 31, 2019 Part A: Cost Classification (Chapter 2, 6) (5 marks) 1,782,918 717,567 Required: Classify each of the below operating expenses as variable or fixed. Cost Variable or Fixed 1,065,351 Cost of goods sold increases proportionately with sales Employees are paid fixed monthly salaries supplemented by a commission on all sales except for the Parts & Service department's sales (see note 1 below for sales for each segment). 104,000 Monthly Salaries To be calculated by the group 22,280 Commission as a percentage of sales 11% 34,478 Rent components: 113,488 Monthly Percentage of sales 5,000 3% 94,042 394,917 103,297 Utilities costs incurred are independent of sales volume (they will not change if sales volume changes). Parts and Service expense varies with sales activity and can be traced to each product line. The company uses straight-line depreciation on all depreciable assets. 866,502 198,849 7,000 The property taxes are set by the City and do not change with changes in sales volume. Advertising budgets are committed to at the beginning of each year. 191,849 49,881 Note 1: Sales by Segment (taken from Q2 segmented income statement) 141,969 Cross Country Ski Packages Mountain Bikes Sales $ 623,047 $ 9 10 Sales 11 Cost of goods sold 12 Gross margin 13 Operating expenses: (See notes) 14 Advertising 15 Depreciation 16 Property taxes 17 Rent 18 Parts & service expenses 19 Salaries and commissions 20 Utilities 21 Total operating expenses 22 Operating income 23 Interest expenses 24 Income before taxes 25 Income taxes 26 Net income 27 30 Accessories 734,066 $ Parts & Service 287,590 $ 138,215 Part B: CVP Income Statement (Chapter 6) (13 marks) Prepare a contribution margin income statement (below), using the traditional income statement provided and the cost information provided in Part A Check figures have been provided to ensure you are on the right track. See the word document provided to your group! Mountain Sports Ltd. Contribution Margin Income Statement For the Year Ended Dec 31, 2019 TOTAL PERCENT Sales $1,782,918 Less: Variable Costs (must be listed in alphabetical order): Total variable costs Less: Fixed Costs (must be listed in alphabetical order) Advertising TOTAL 100% Note from Instructor: All formulas must be completed within the answer boxes. Do not use a calculator and input the final answer. It will result in rounding errors and you will be marked as incorrect. This is applicable for all calculations in the case study. Note from Instructor: You will be marked as incorrect if you do not follow instructions! Please read carefully! 62 Part C: CVP Analysis (Chapter 6) (9 marks) 63 Calculate the following and explain each calculation (in your own words). Be sure to explain what the number you've calculated means, ensuring you write it in a way so that a non- 64 accountant can understand. For example, if you calculate a breakeven point of $1,000, what does $1,000 mean? Marks will not be awarded for textbook definitions. 65 Calculation Explanation 1) Breakeven Point in Sales Dollars 2) Margin of Safety (In percent) 67 3) Degree of Operating Leverage (DOL) (operating income to be used in calculation) 68 4) The junior accountant left a note for you: In the managerial accounting course that I took, I learned that degree of operating leverage is a measure of risk. I don't really understand that. Can you help me? What does leverage mean? Is it better to have high leverage or low leverage? The owners have asked me if they should focus more on variable costs or fixed costs, what should I say? They expect that sales will increase next year. N/A - no calculations needed 69 66 Note from Instructor: You may increase the size of the columns, however, do not change the formatting. Do not merge cells in any of the answer boxes. In other questions, you may need to increase the size of the column but again, please do not merge any cells. Mountain Sports Ltd. Contribution Margin Income Statement For the Year Ended Dec 31, 2019 TOTAL Sales $1,782,918 Less: Variable Costs (must be listed in alphabetical order): Rent Total variable costs Contribution Margin 736,904 Less: Fixed Costs (must be listed in alphabetical order) Advertising Rent TOTAL Operating Income Less: Interest Expense Earnings Less: Income Taxes Net Income Income Taxes 198,849 7,000 191,849 49,881 141,969 PERCENT 100% 41.3% Cross Country Ski Packages Amount Percent SALES 623,047 Less: Variable Costs (MUST BE LISTED ALPHABETICALLY) Cost of Goods Sold 276,633 TOTAL CONTRIBUTION MARGIN 223,563 Less: Traceable Fixed Costs (MUST BE LISTED ALPHABETICALLY) TOTAL Traceable Fixed Costs SEGMENT MARGIN $ 189,563 Less: Common Fixed Costs (MUST BE LISTED ALPHABETICALLY) Advertising 100% 44.4% 35.9% 30.4% $ Mountain Sports Ltd. Segmented Income Statement-By Product Line For the Year Ended December 31, 2019 Mountain Bikes Accessories Percent Amount 734,066 341,414 Amount 247,910 205,910 100.0% 46.5% 33.8% 28.1% $ 287,590 72,789 158,094 150,094 Percent 100.0% 25.3% 55.0% 52.2% $ Parts and Service Departme Amount Perc 138,215 26,731 107,338 25,338 1 TOTAL Traceable Fixed Costs SEGMENT MARGIN $ 189,563 Less: Common Fixed Costs (MUST BE LISTED ALPHABETICALLY Advertising TOTAL Common F/C OPERATING INCOME Less: Interest Expense Lamings before taxes Less: Income Tax NET INCOME 30.4% 5 205,910 Norma 28.1% 5 150,094 No Spacing 52.2% 5 Heading 1 25,338 18.35 570,904 372.055 198,849 7,000 191,849 49.881 141,969 Styles Pane 32.0% BMX Product Line. Budgeted CVP Income Statement For the year ended December 31, 2020 TOTAL Number of Bikes Sales Revenue Less: Variable Costs (must be listed alphabetically) Total Variable Costs Contribution Margin Less: Fixed Costs (must be listed alphabetically) Total Fixed Cost BMX SEGMENT MARGIN Per Bike 420 57,624 $ 41,837 137.20 Percentage 100% 39% ercent of Sales stimated Sales ASH BALANCE, Beginning Collections from customers: Cash Sales Credit Sales ASH AVAILABLE ess: Cash Payments Merchandise purchases (COGS) Sales Commissions Advertising Property Taxes Rent Salaries & Wages Equipment Purchase Income tax Installment Total Disbursements ash Excess (Deficiency) Inancing (Note 1) Borrow Repayment of Principal (show as negative) let Financing. Cash Balance, Ending $ Mountain Sports Cash Budget For the year ended December 31 Quarter 2 28% 29% $147,000 $152,250 56,000 58,800 217,300 -102,500 21,500 $ 3 21% $110,250 143,088 139,038 21,513 $ 21,925 $ 4 22% $115,500 121,825 21,450 $ Year Summary 100% $525,000 621,250 137,000 -6.000 131,000 21,450


