Answered step by step
Verified Expert Solution
Link Copied!

Question

1 Approved Answer

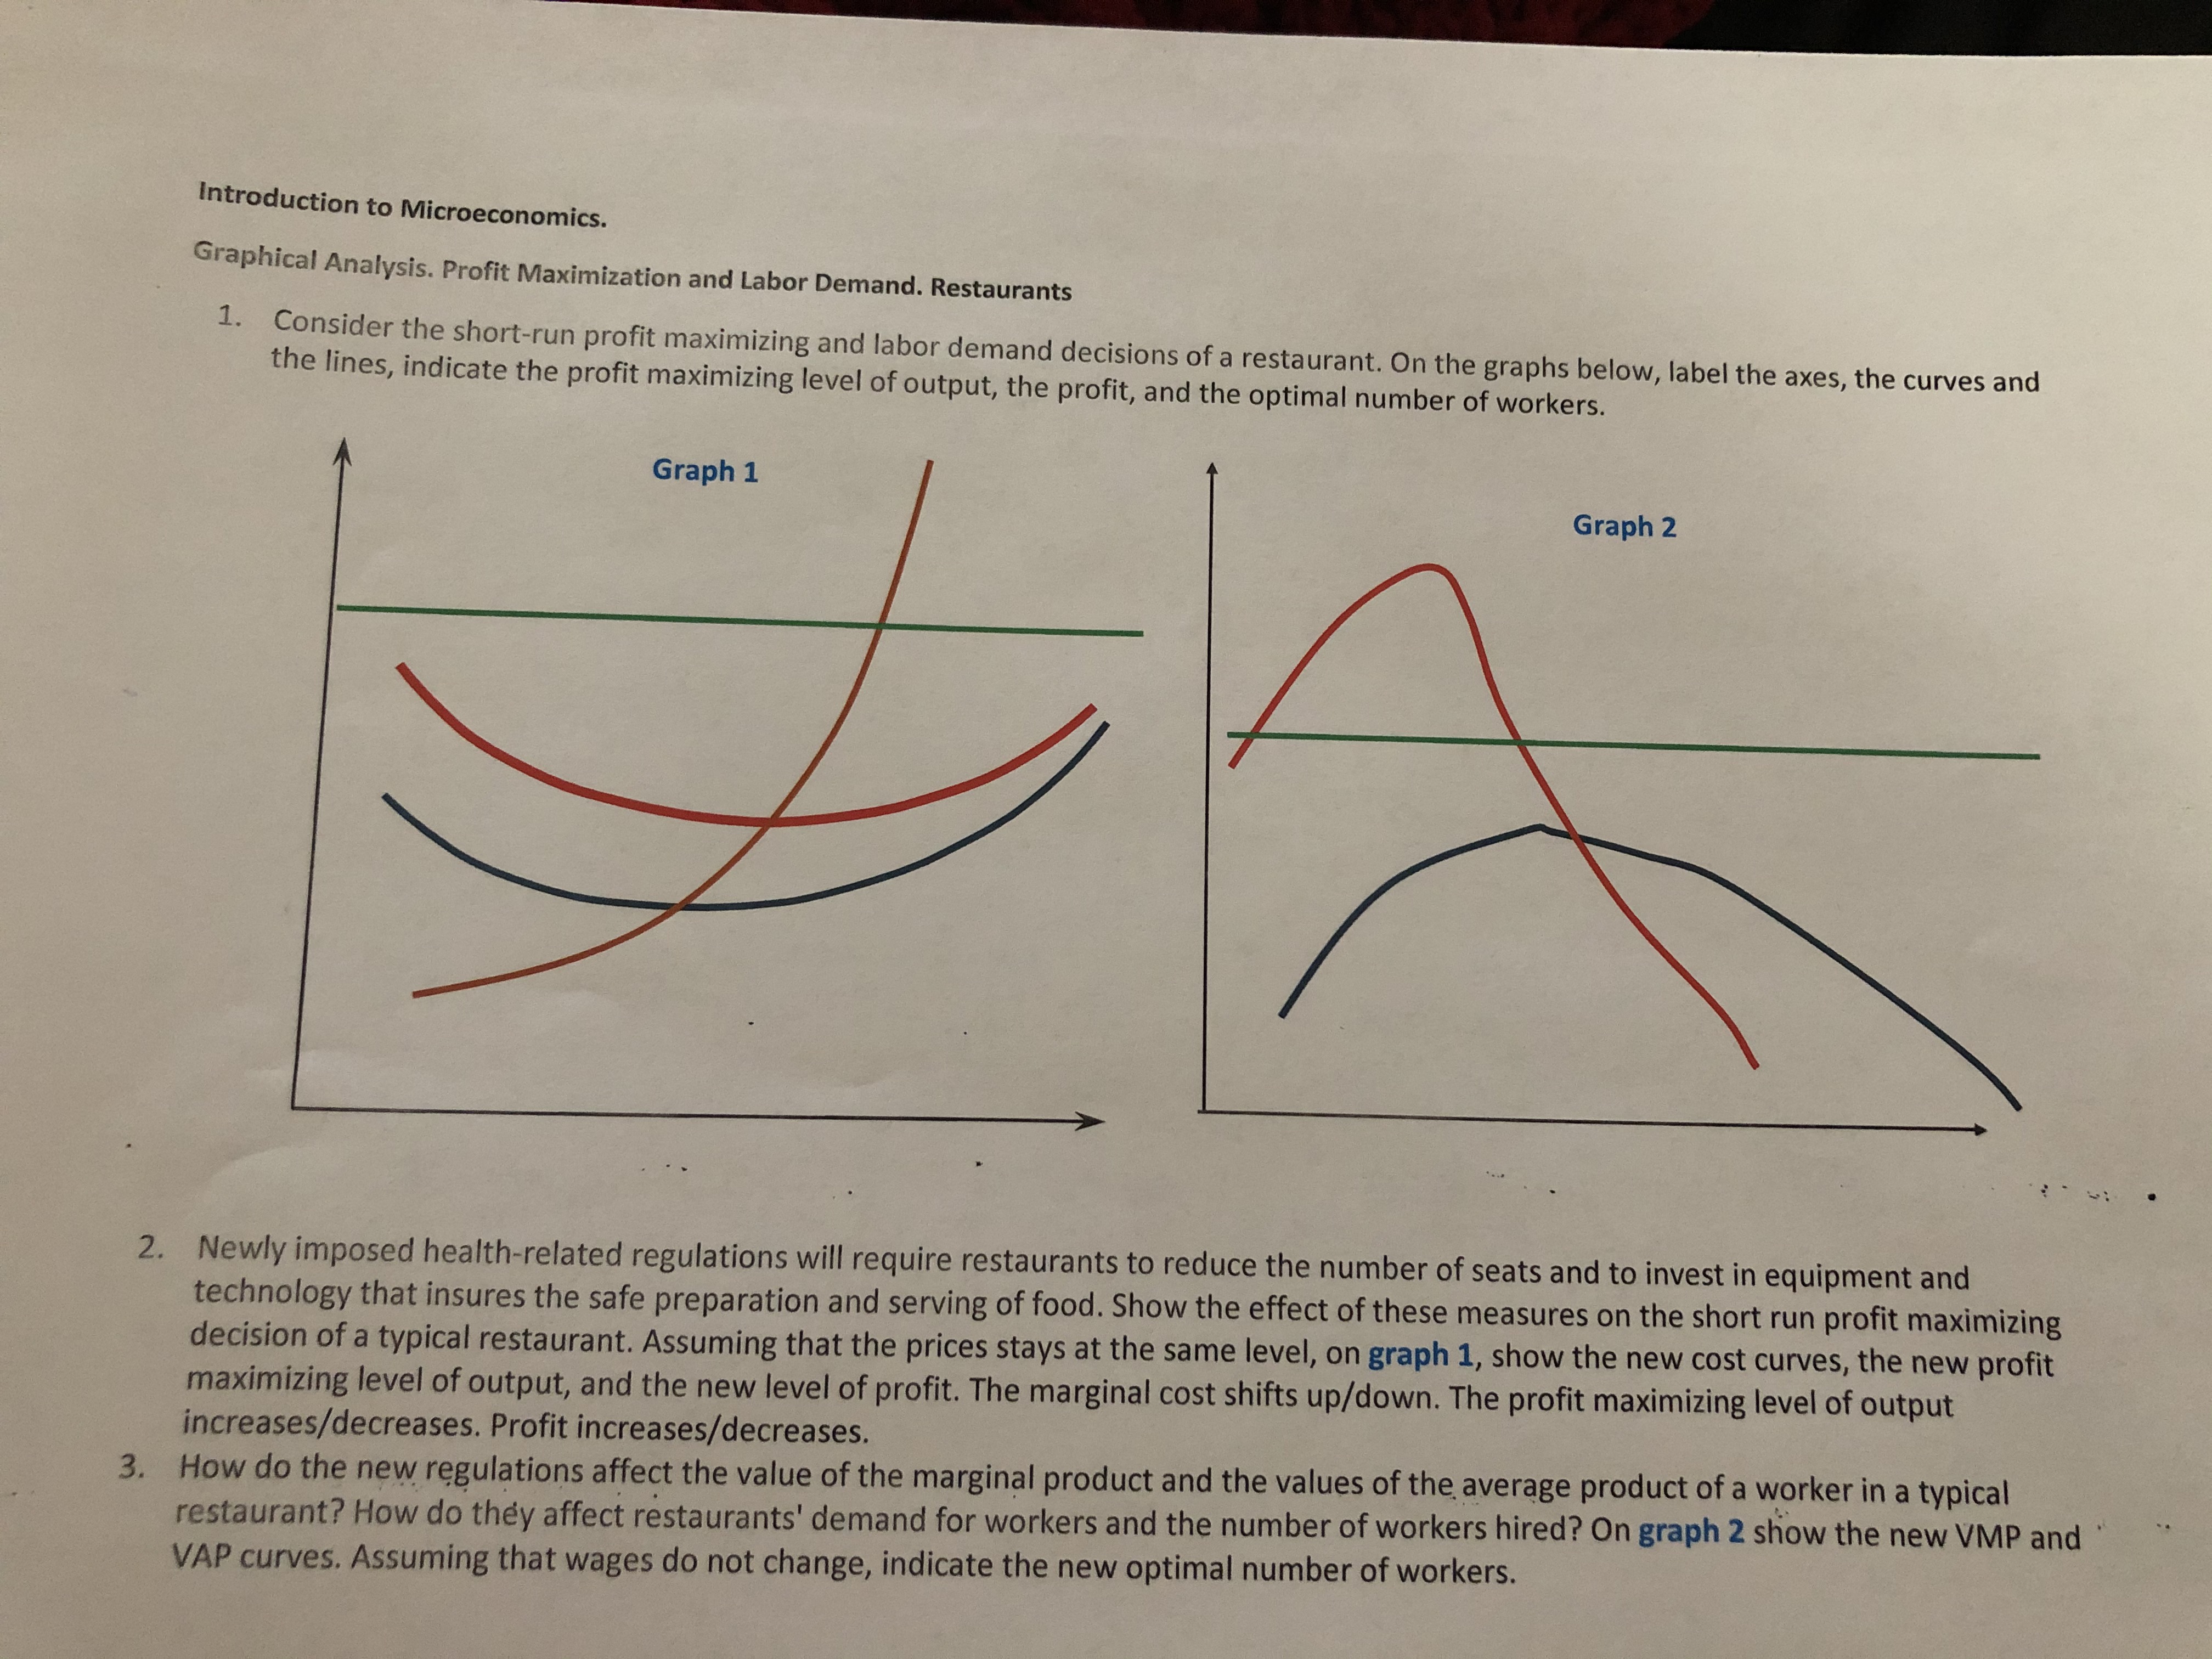
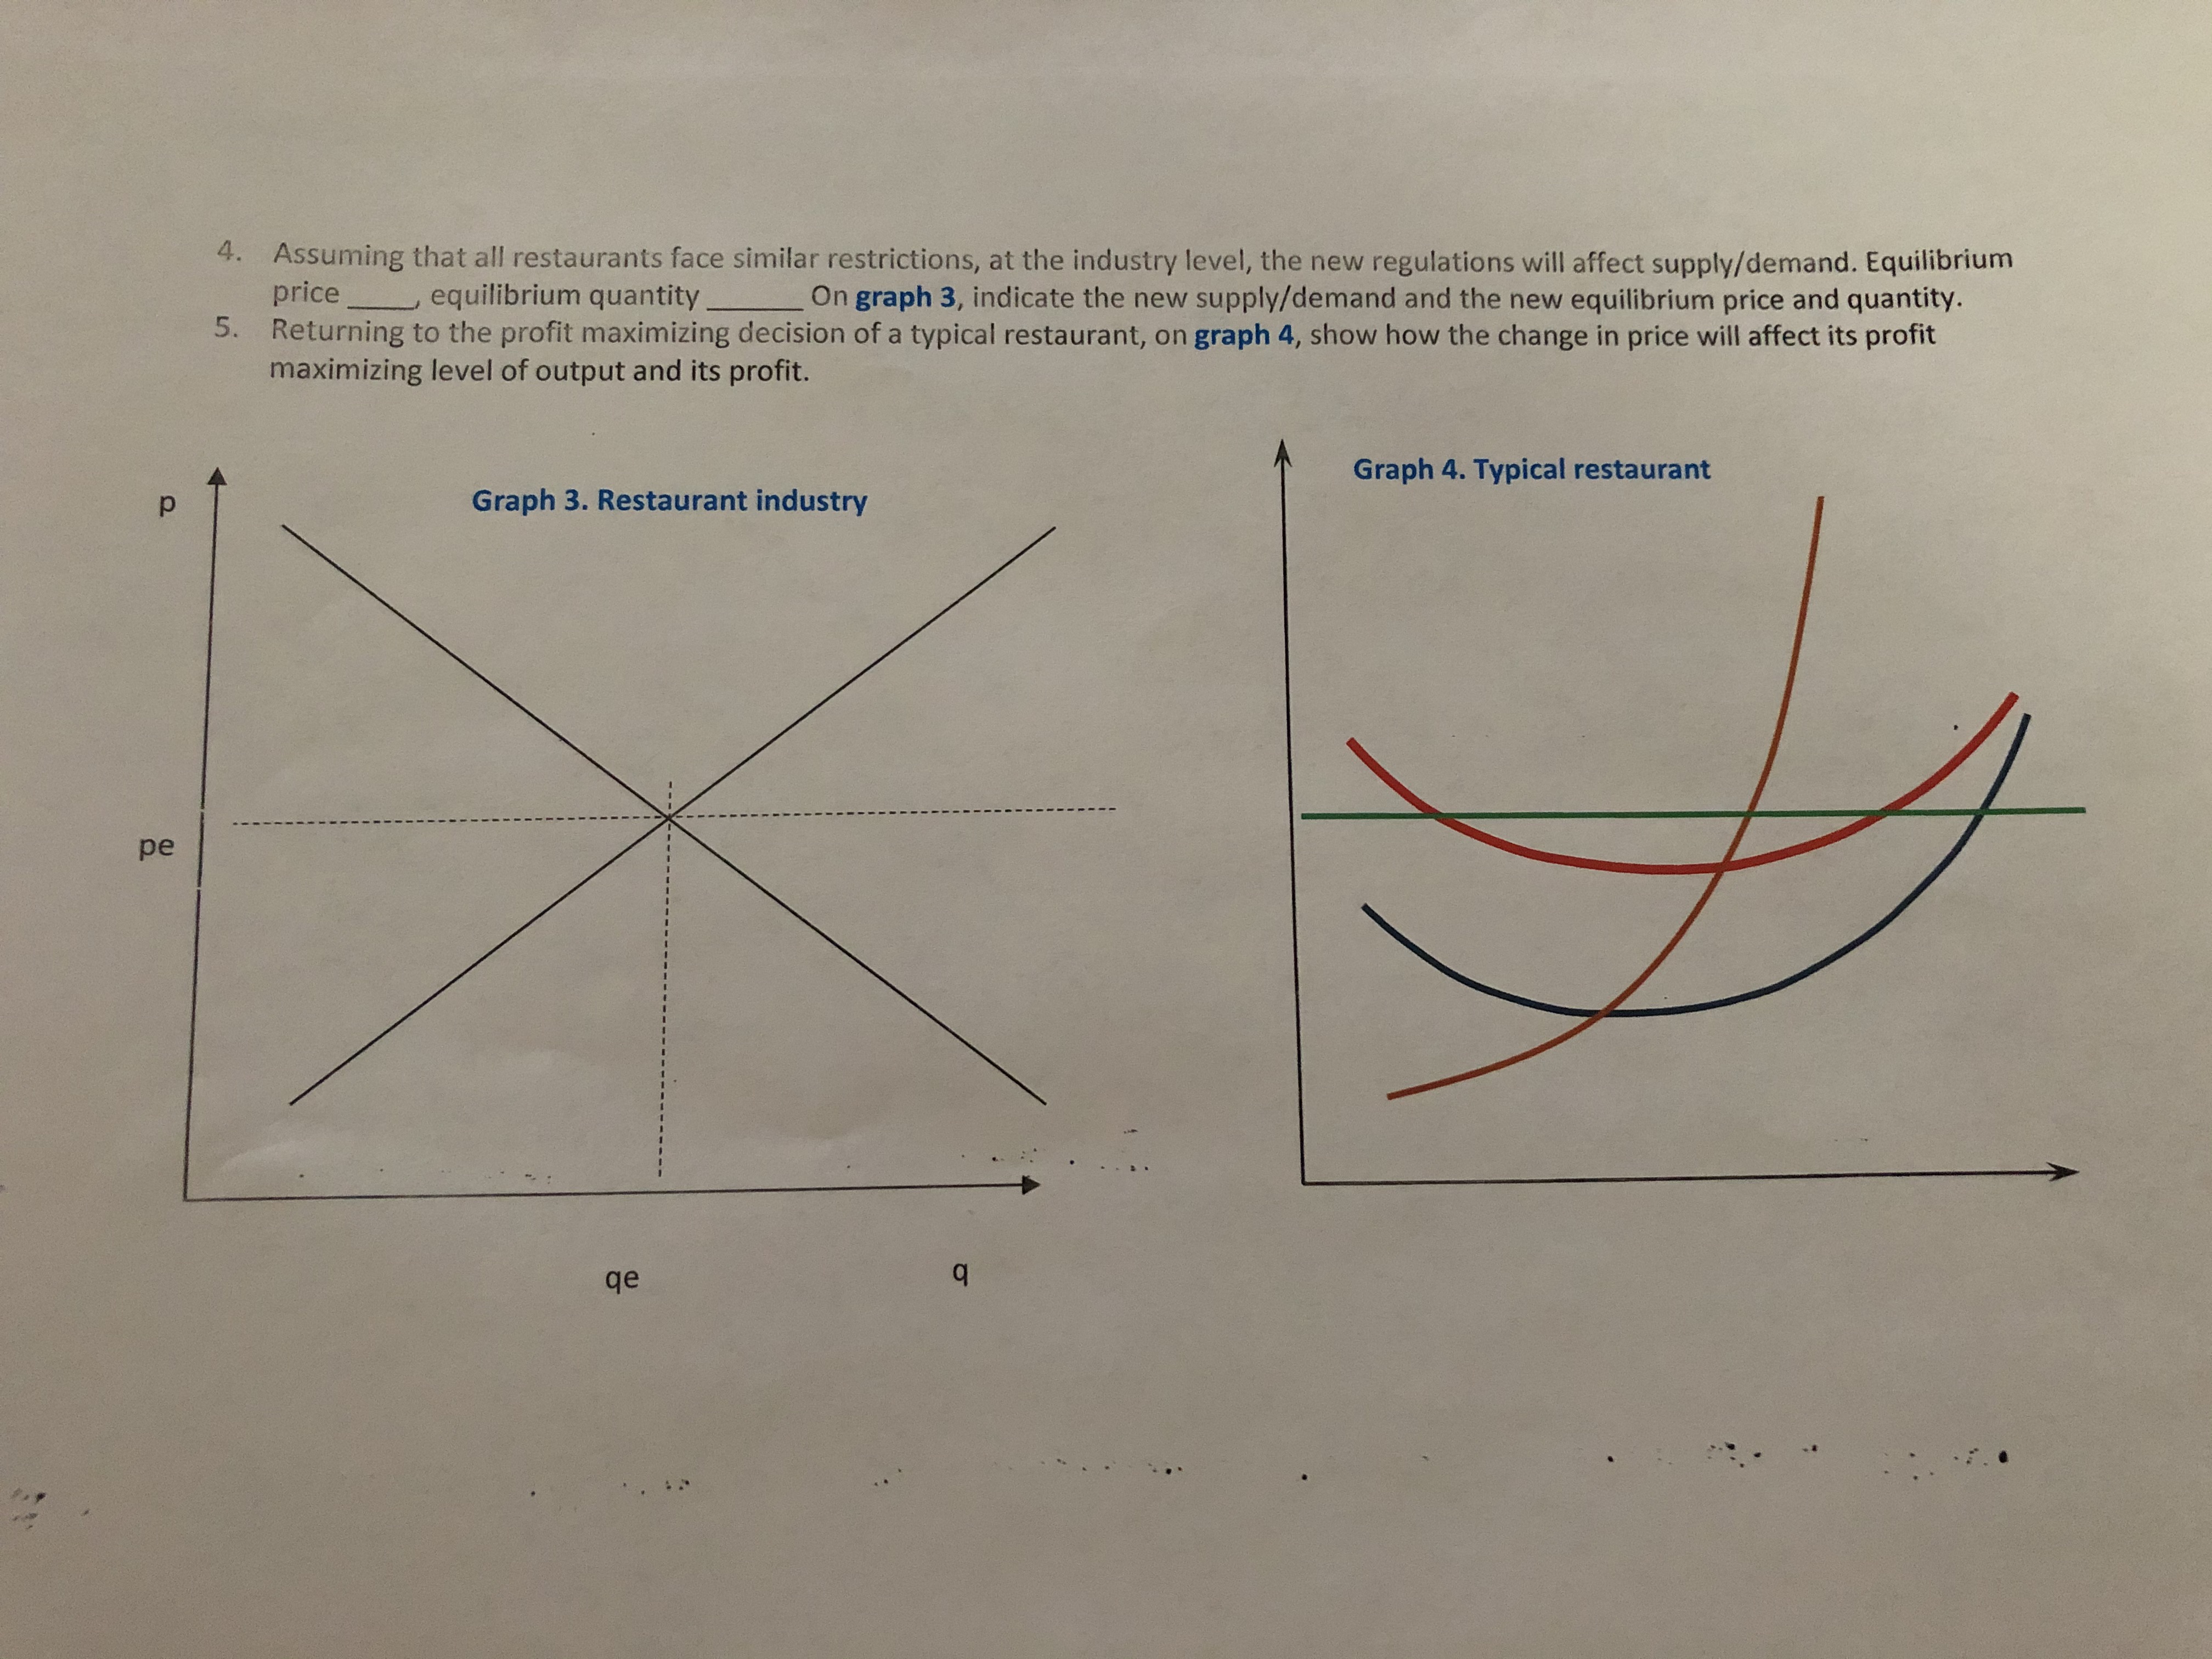
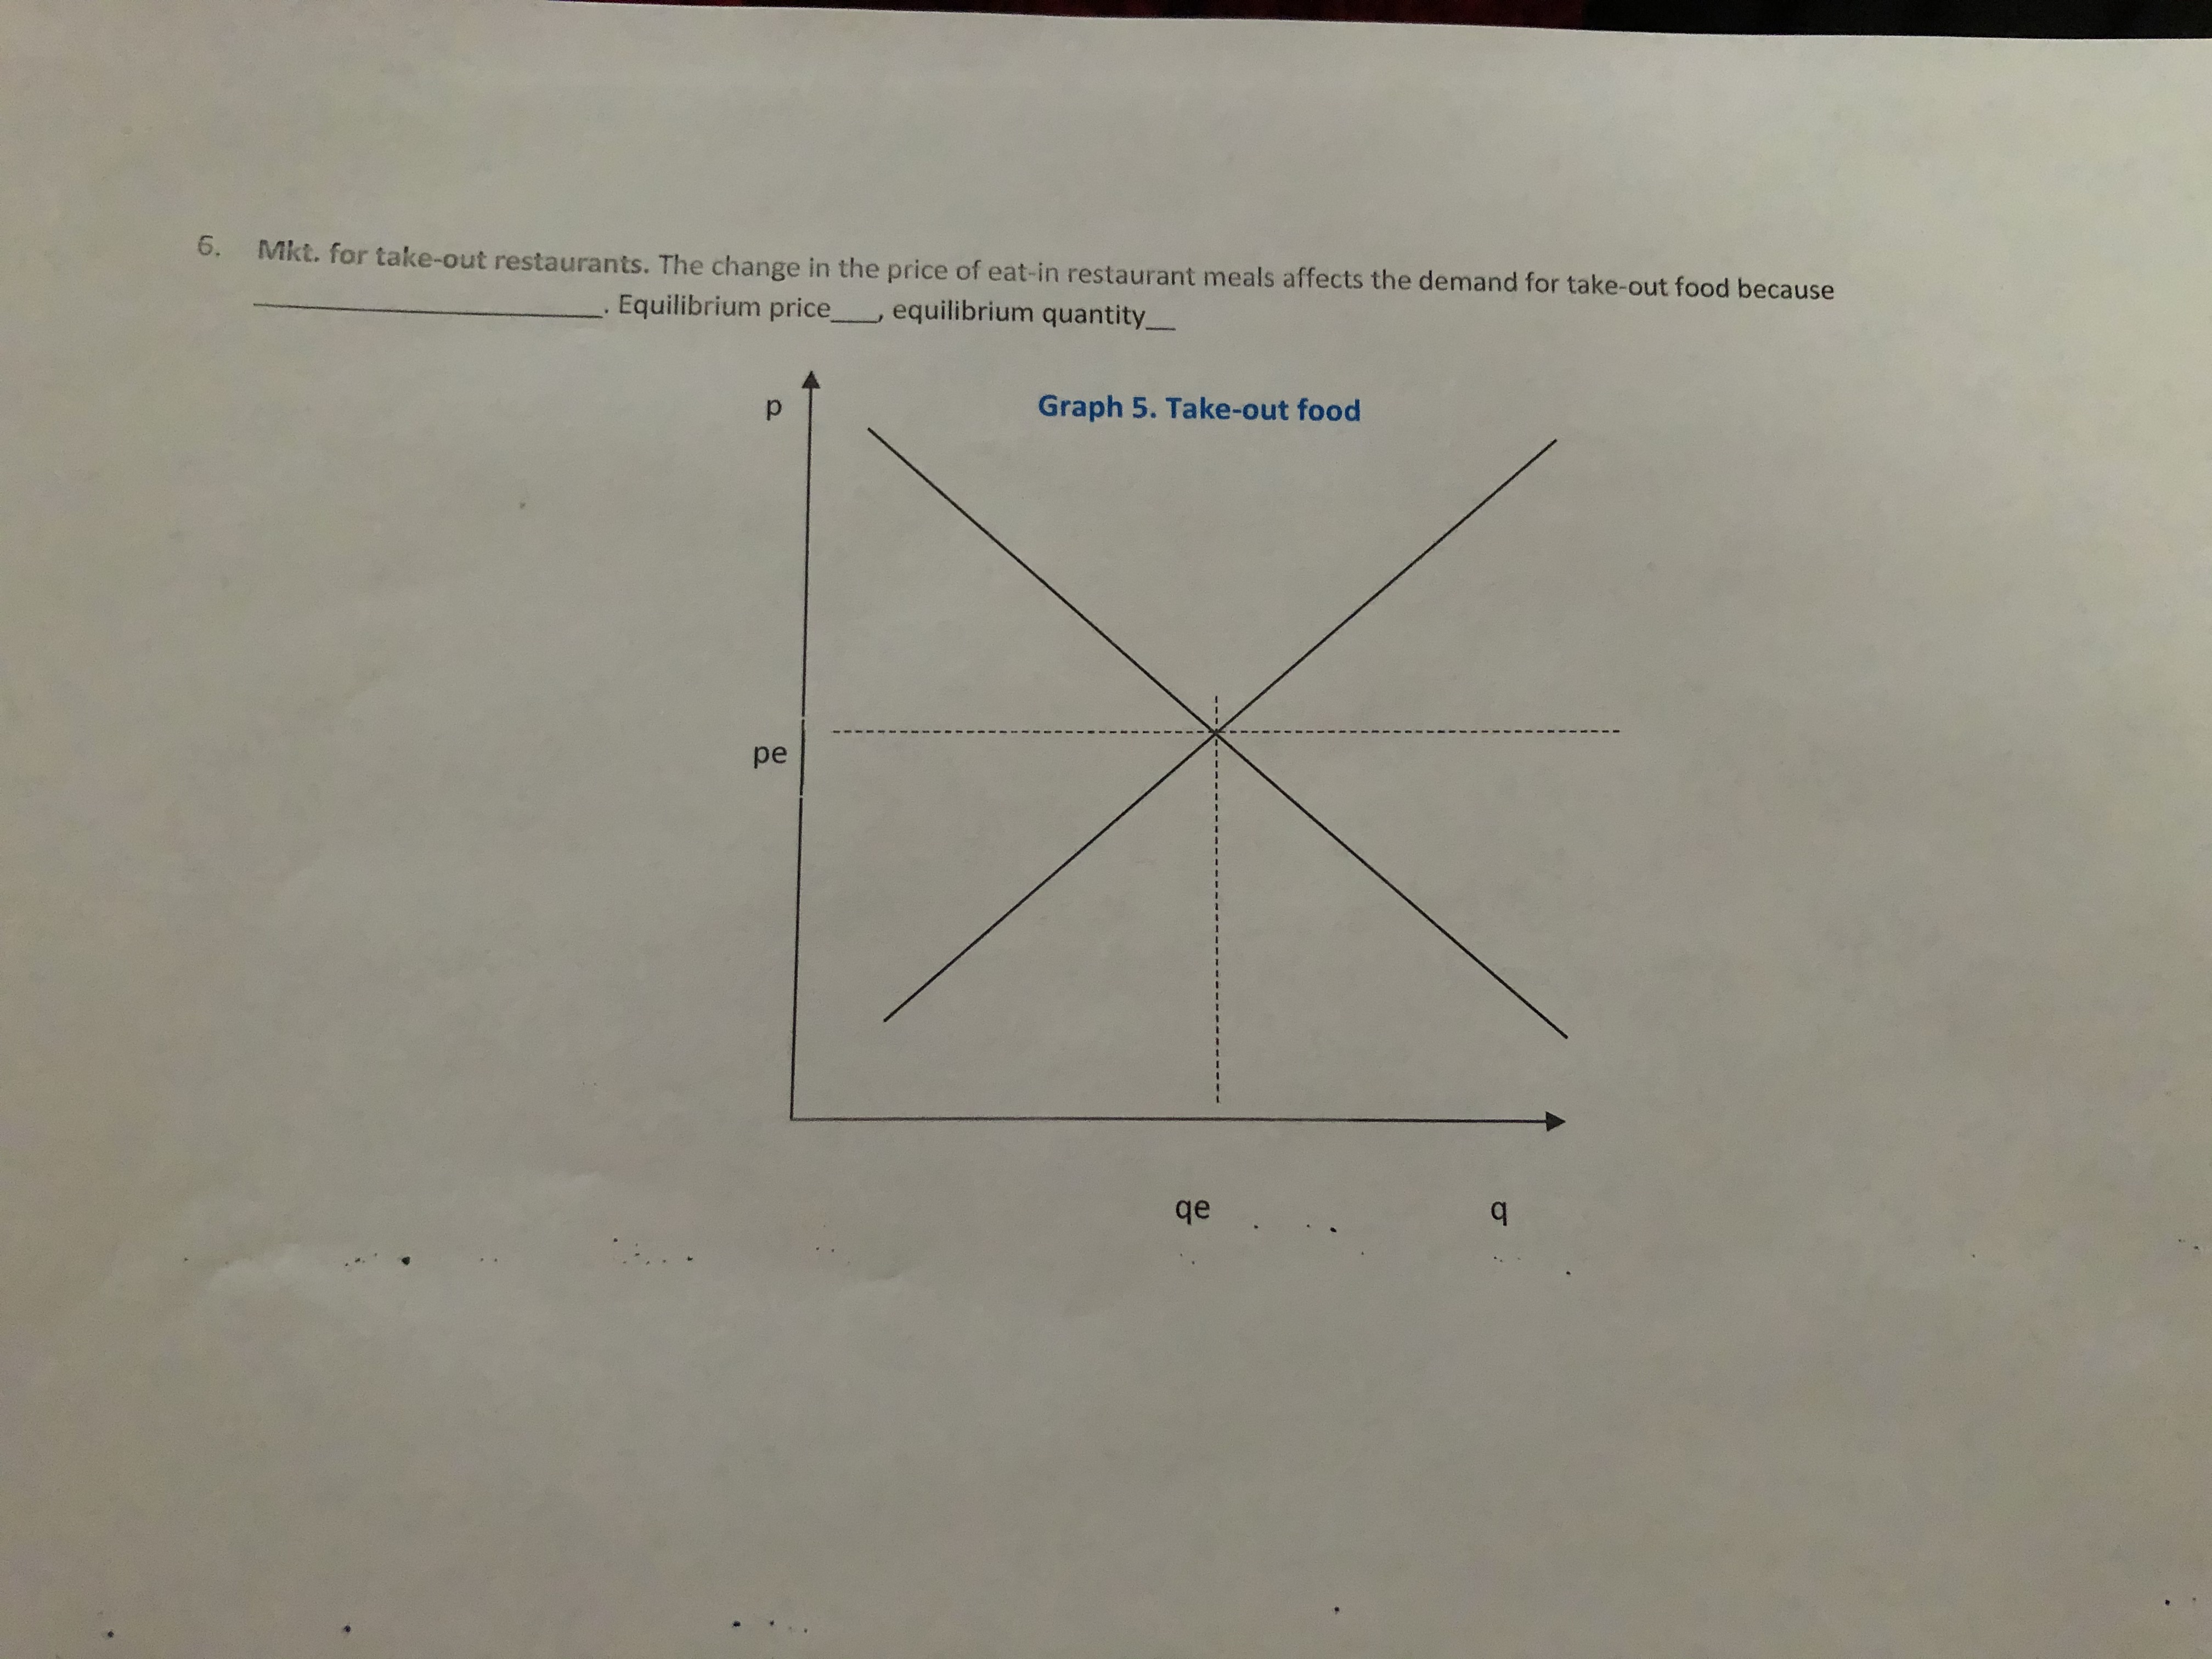
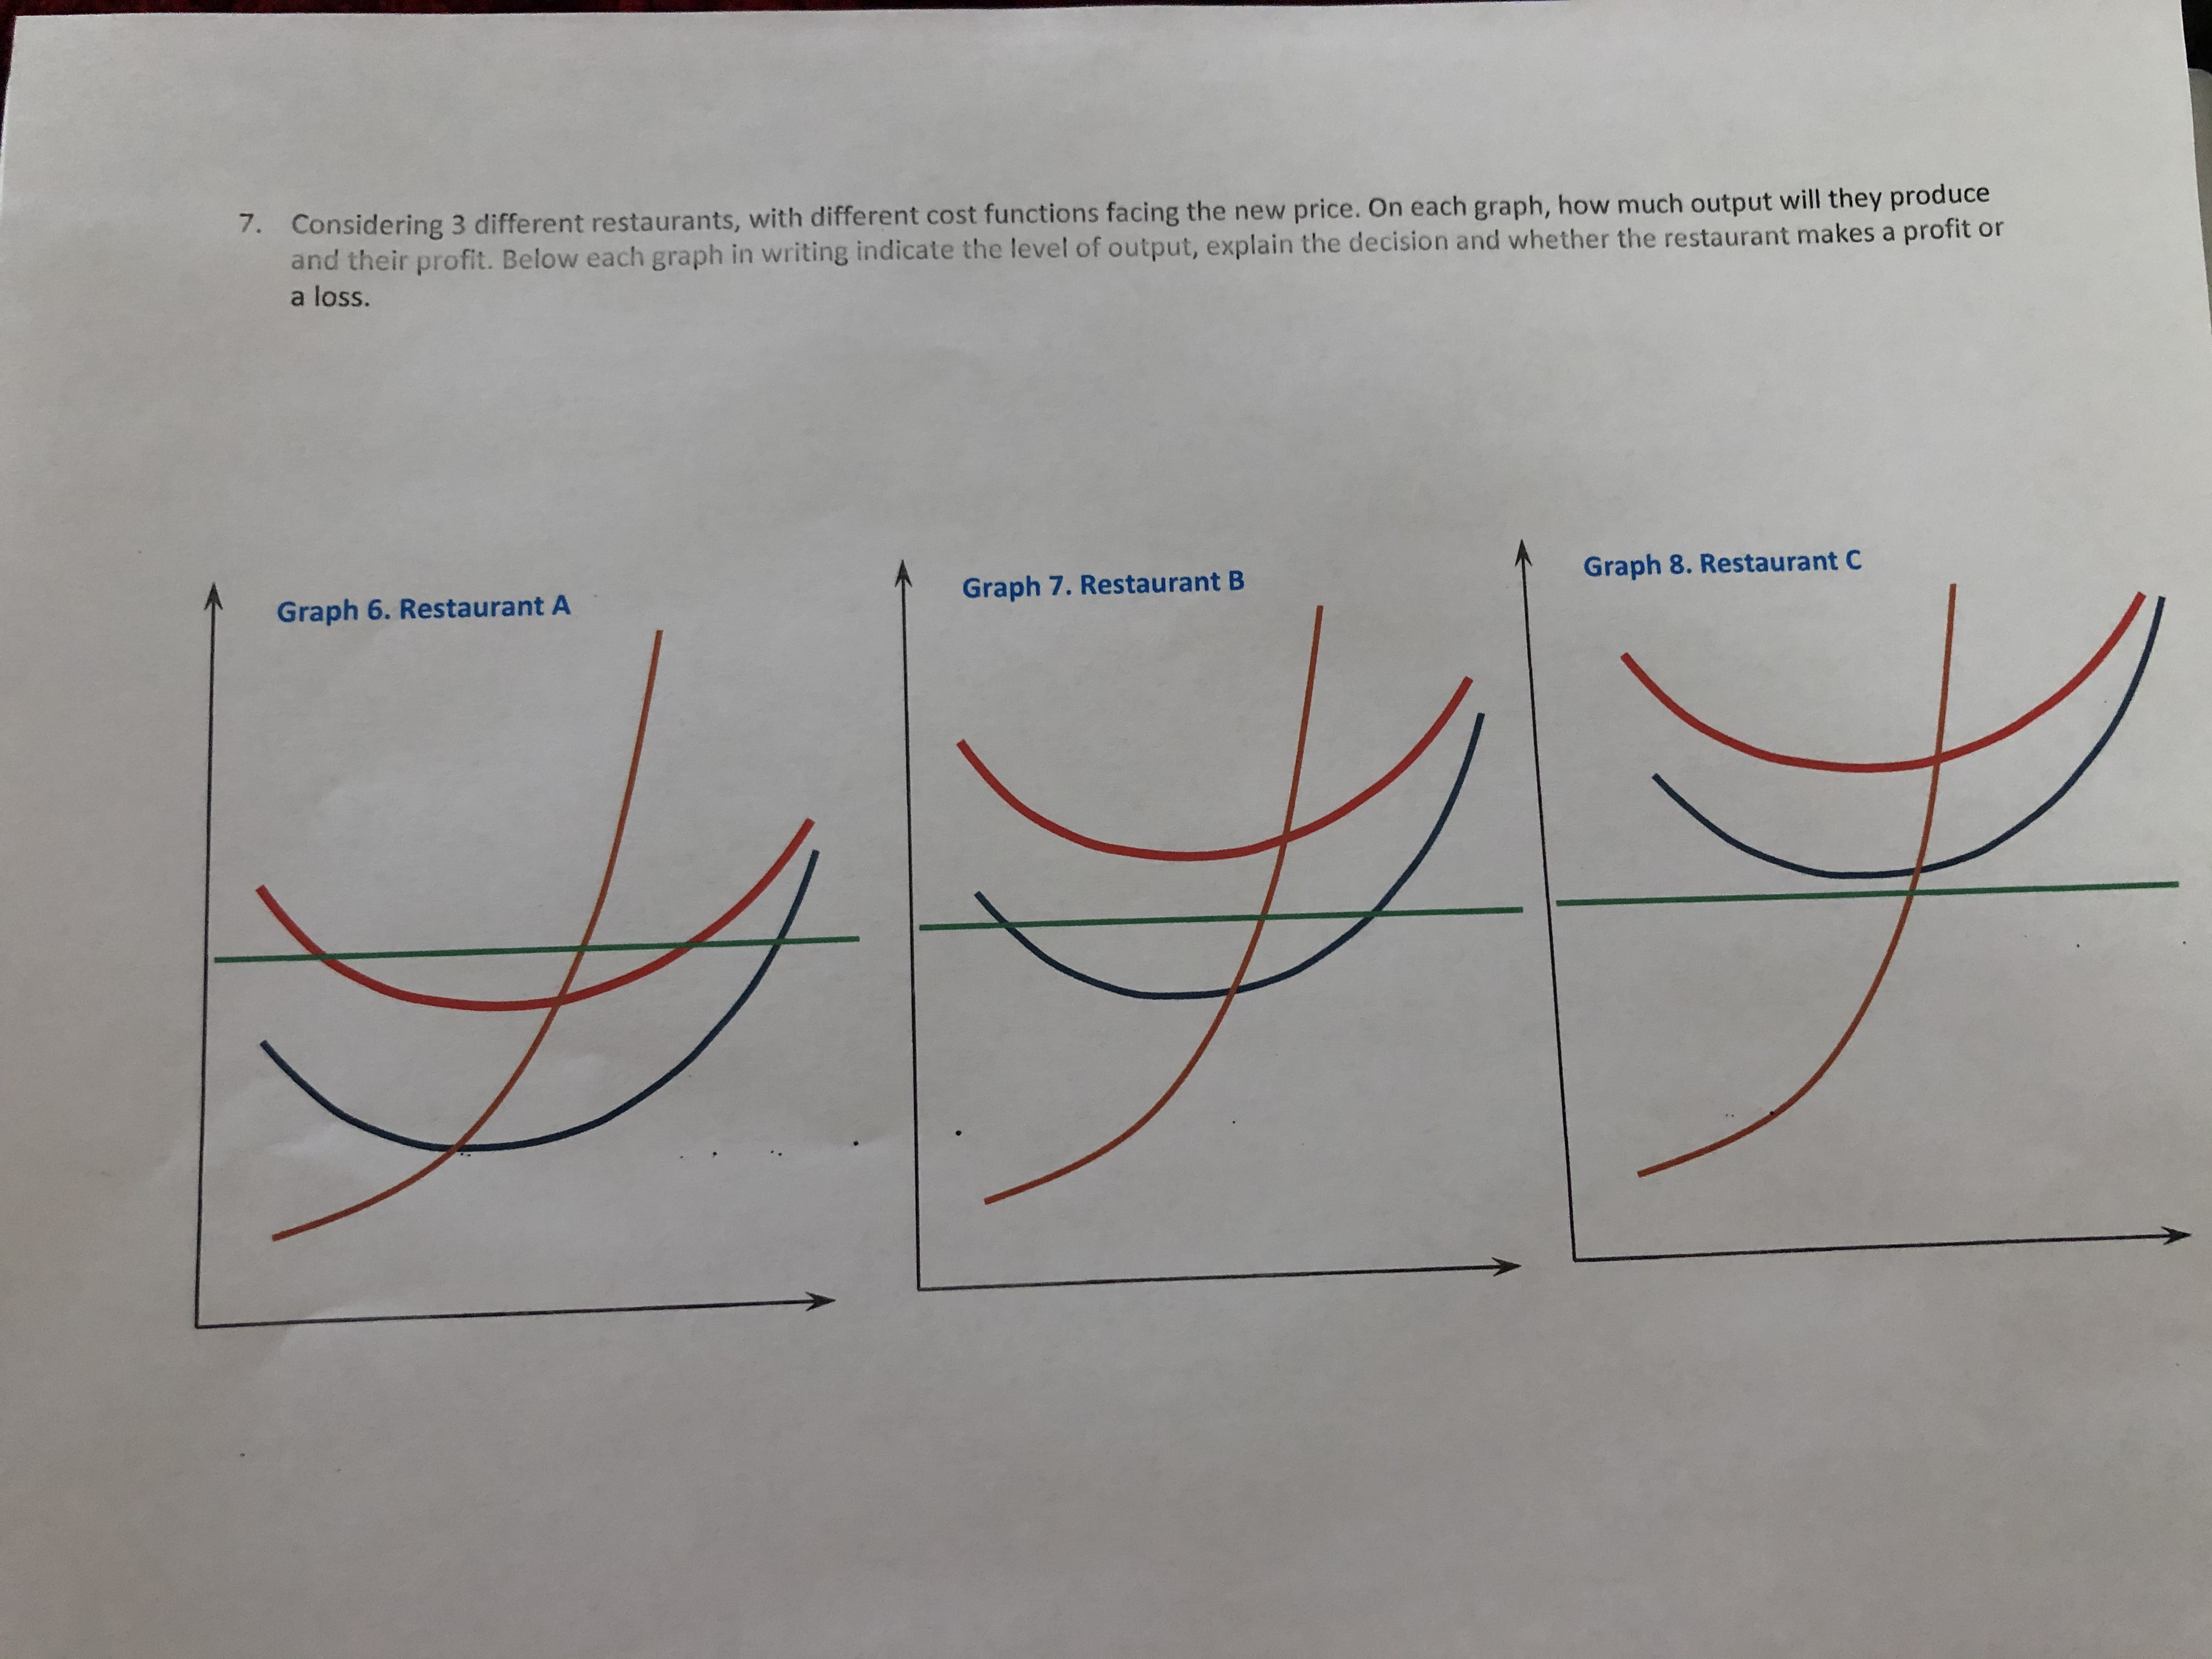
Please answer the following Introduction to Microeconomics . Graphical Analysis. Profit Maximization and Labor Demand. Restaurants Consider the short-run profit maximizing and labor demand decisions

Please answer the following

image text in transcribedimage text in transcribedimage text in transcribedimage text in transcribed
Introduction to Microeconomics . Graphical Analysis. Profit Maximization and Labor Demand. Restaurants Consider the short-run profit maximizing and labor demand decisions of a restaurant. On the graphs below, label the axes, the curves and the lines, indicate the profit maximizing level of output, the profit, and the optimal number of workers. Graph 1 L Graph 2 " : 2. Newly imposed health-related regulations will require restaurants to reduce the number of seats and to invest in equipment and technology that insures the safe preparation and serving of food. Show the effect of these measures on the short run profit maximizing decision of a typical restaurant. Assuming that the prices stays at the same level, on graph 1, show the new cost curves, the new profit maximizing level of output, and the new level of profit. The marginal cost shifts up/down. The profit maximizing level of output increases/decreases. Profit increases/decreases. 3. How do the new regulations affect the value of the marginal product and the values of the average product of a worker in a typical restaurant? How do they affect restaurants' demand for workers and the number of workers hired? On graph 2 show the new VMP and VAP curves. Assuming that wages do not change, indicate the new optimal number of workers.Assuming that all restaurants face similar restrictions, at the industry level, the new regulations will affect supply/demand. Equilibrium price _ _ equilibrium quantity_ On graph 3, indicate the new supply/demand and the new equilibrium price and quantity. Returning to the profit maximizing decision of a typical restaurant, on graph 4, show how the change in price will affect its profit maximizing level of output and its profit. Graph 3. Restaurant industry Graph 4. Typical restaurant pe6. Mkt. for take-out restaurants. The change in the price of eat-in restaurant meals affects the demand for take-out food because Equilibrium price_ equilibrium quantity_ Graph 5. Take-out food pe . .. ' ... . .7. Considering 3 different restaurants, with different cost functions facing the new price. On each graph, how much output will they produce and their profit. Below each graph in writing indicate the level of output, explain the decision and whether the restaurant makes a profit or a loss. Graph 6. Restaurant A Graph 7. Restaurant B Graph 8. Restaurant C

Step by Step Solution

There are 3 Steps involved in it

Step: 1

blur-text-image

Get Instant Access to Expert-Tailored Solutions

See step-by-step solutions with expert insights and AI powered tools for academic success

Step: 2

blur-text-image

Step: 3

blur-text-image

Ace Your Homework with AI

Get the answers you need in no time with our AI-driven, step-by-step assistance

Get Started

Recommended Textbook for

Lectures On Urban Economics

Authors: Jan K Brueckner

1st Edition

0262300311, 9780262300315

More Books

Students also viewed these Economics questions