

Question
Please answer the following question, I am struggled with it Problem 1. When John started his freshman year at GWU, his parents decided to make
Please answer the following question, I am struggled with it
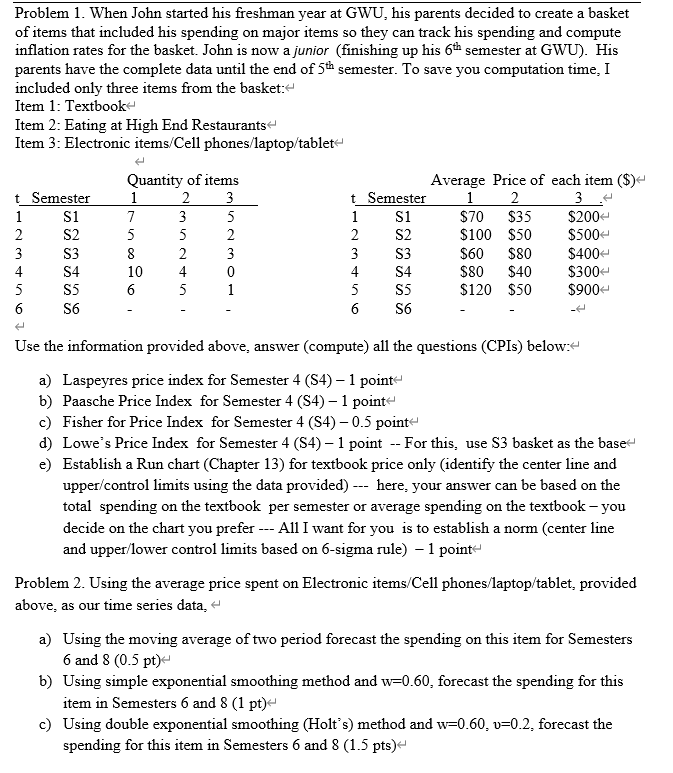
Problem 1. When John started his freshman year at GWU, his parents decided to make a basket of items that included his spending on major items so they can track his spending and compute inflation rates for the basket. John is now a junior (finishing up his 6th semester at GWU).His parents have the complete data until the end of 5th semester. To save you computation time, I included only three items from the basket:
Item 1: Textbook
Item 2: Eating at High End Restaurants
Item 3: Electronic items/Cell phones/laptop/tablet
Quantity of itemsAverage Price of each item ($)
tSemester123 tSemester123.
1S17351S1$70$35$200
2S25522S2$100$50$500
3S38233S3$60$80$400
4S410404S4$80$40$300
5S56515S5$120$50$900
6S6---6S6---
Use the information provided above, answer (compute) all the questions (CPIs) below:
a)Laspeyres price index for Semester 4 (S4)
b)Paasche Price Index for Semester 4 (S4)
c)Fisher for Price Index for Semester 4 (S4)
d)Lowe's Price Index for Semester 4 (S4) -- For this, use S3 basket as the base
e)Establish a Run chart (Chapter 13) for textbook price only (identify the center line and upper/control limits using the data provided) ---here, your answer can be based on the totalspending on the textbookper semester or average spending on the textbook - you decide on the chart you prefer --- All I want for youis to establish a norm (center line and upper/lower control limits based on 6-sigma rule)
Question 2:
Using the average price spent on Electronic items/Cell phones/laptop/tablet, provided above, as our time series data,
a)Using the moving average of two period forecast the spending on this item for Semesters 6 and 8 (0.5 pt)
b)Using simple exponential smoothing method and w=0.60, forecast the spending for this item in Semesters 6 and 8 (1 pt)
c)Using double exponential smoothing (Holt's) method and w=0.60, ?=0.2, forecast the spending for this item in Semesters 6 and 8 (1.5 pts)
Question3:
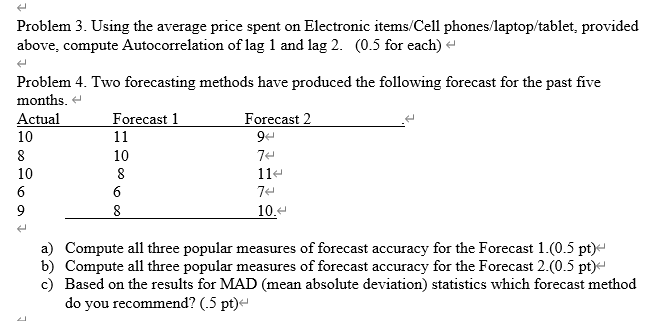
Using the average price spent on Electronic items/Cell phones/laptop/tablet, provided above, compute Autocorrelation of lag 1 and lag 2.(0.5 for each)
Problem 4. Two forecasting methods have produced the following forecast for the past five months.
Actual Forecast 1Forecast 2 .
10 119
8 107
10 811
6 67
9810.
a)Compute all three popular measures of forecast accuracy for the Forecast 1.(0.5 pt)
b)Compute all three popular measures of forecast accuracy for the Forecast 2.(0.5 pt)
c)Based on the results for MAD (mean absolute deviation) statistics which forecast method do you recommend? (.5 pt)
Step by Step Solution
There are 3 Steps involved in it
Step: 1

Get Instant Access to Expert-Tailored Solutions
See step-by-step solutions with expert insights and AI powered tools for academic success
Step: 2

Step: 3
Ace Your Homework with AI
Get the answers you need in no time with our AI-driven, step-by-step assistance
Get Started
Algebra and Trigonometry
Authors: Ron Larson
10th edition
9781337514255, 1337271179, 133751425X, 978-1337271172