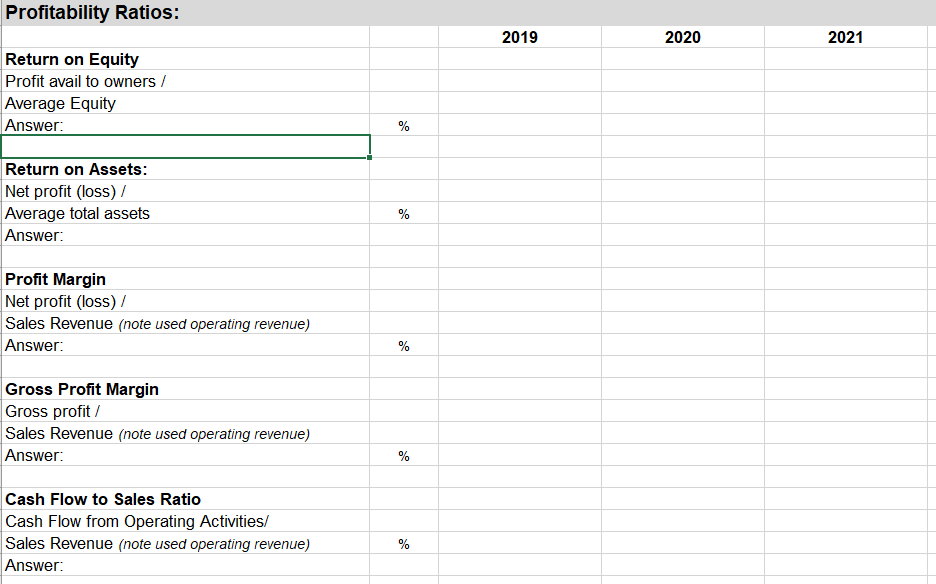
 Please answer the question in the imagine or screenshot an excel table. thx
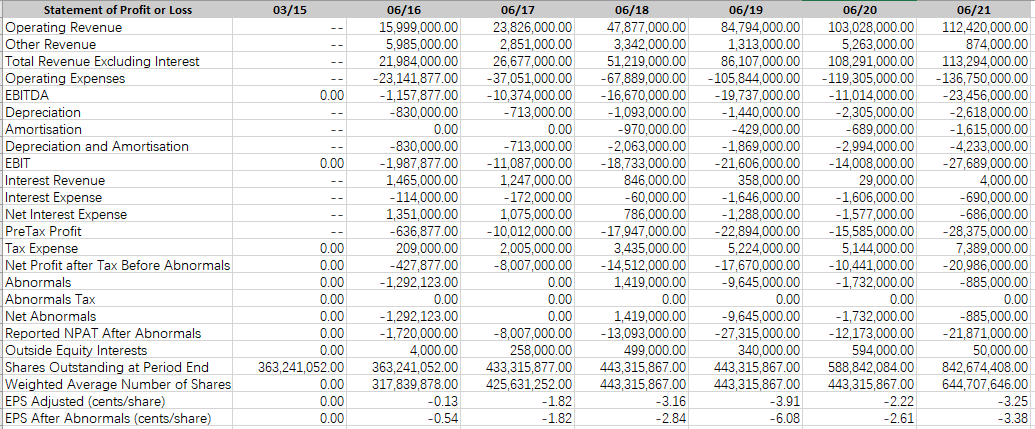
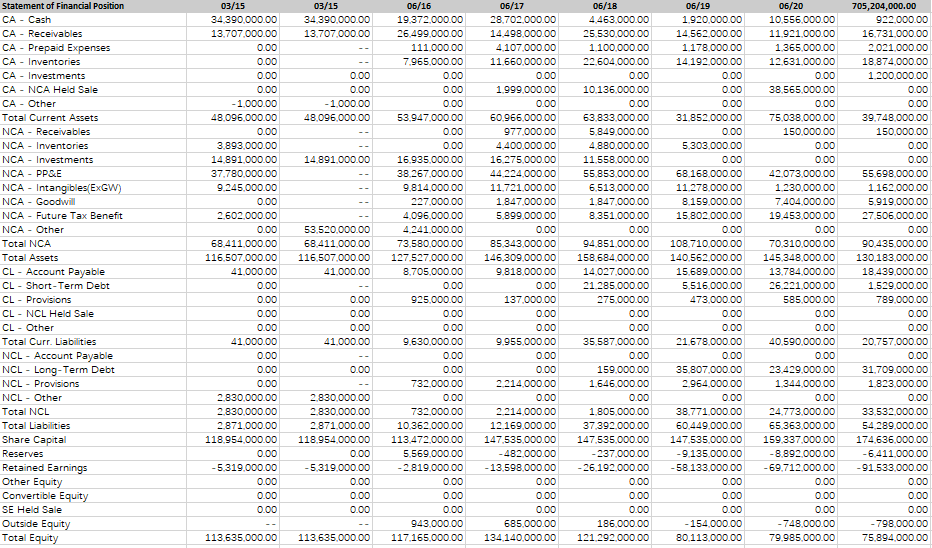
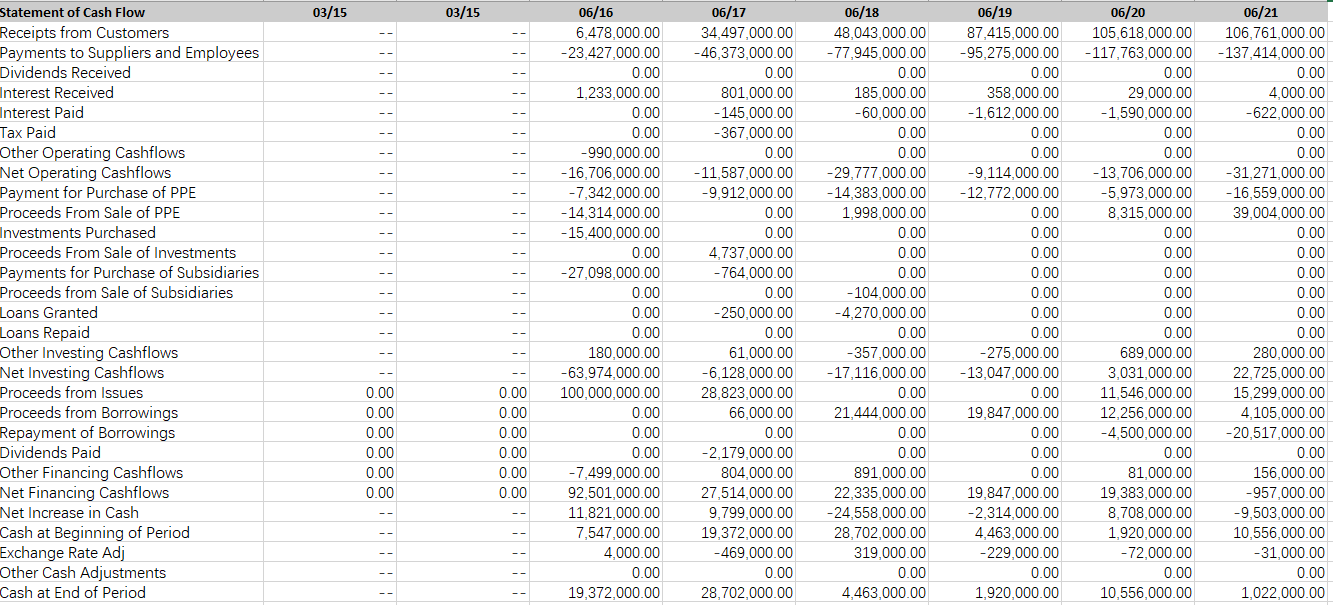
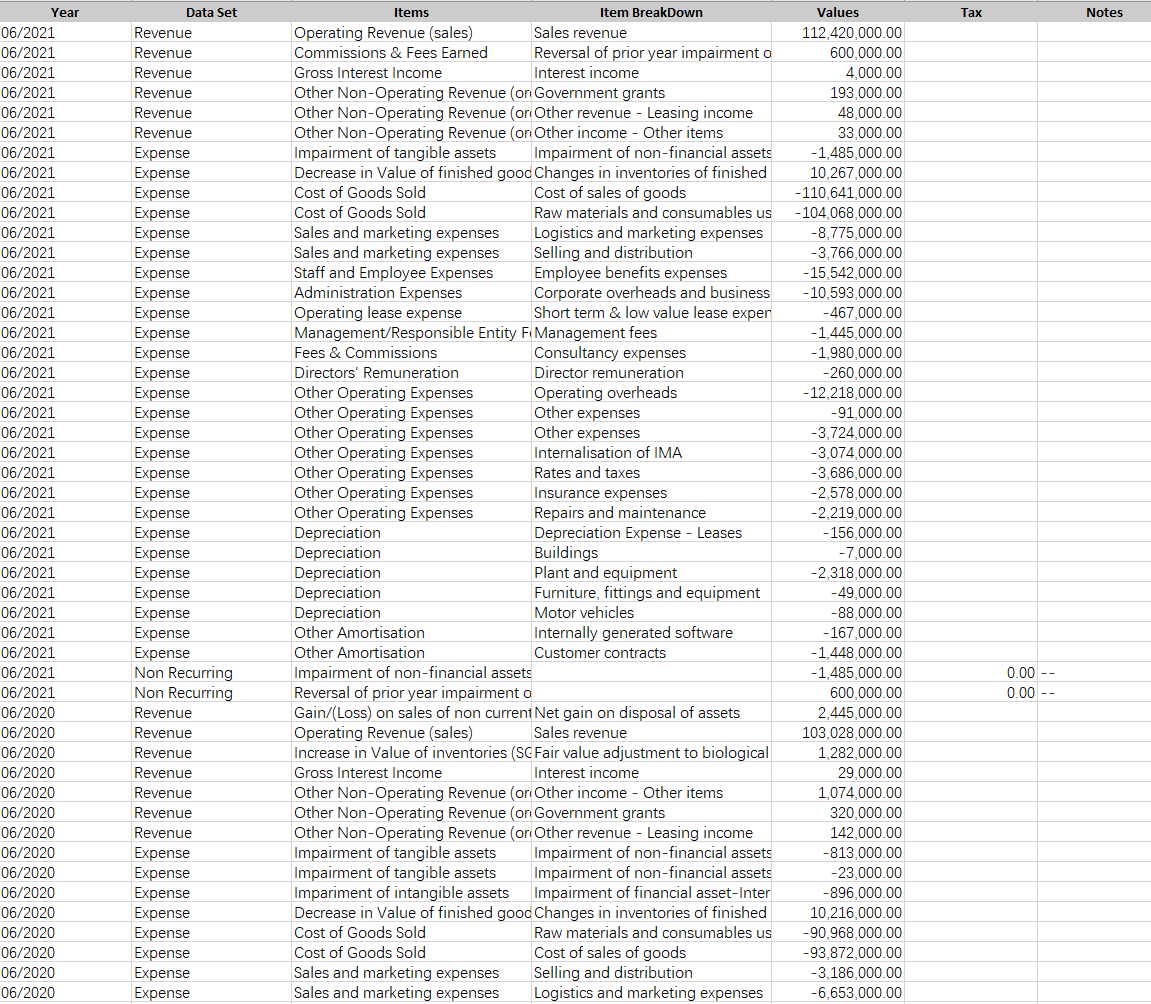
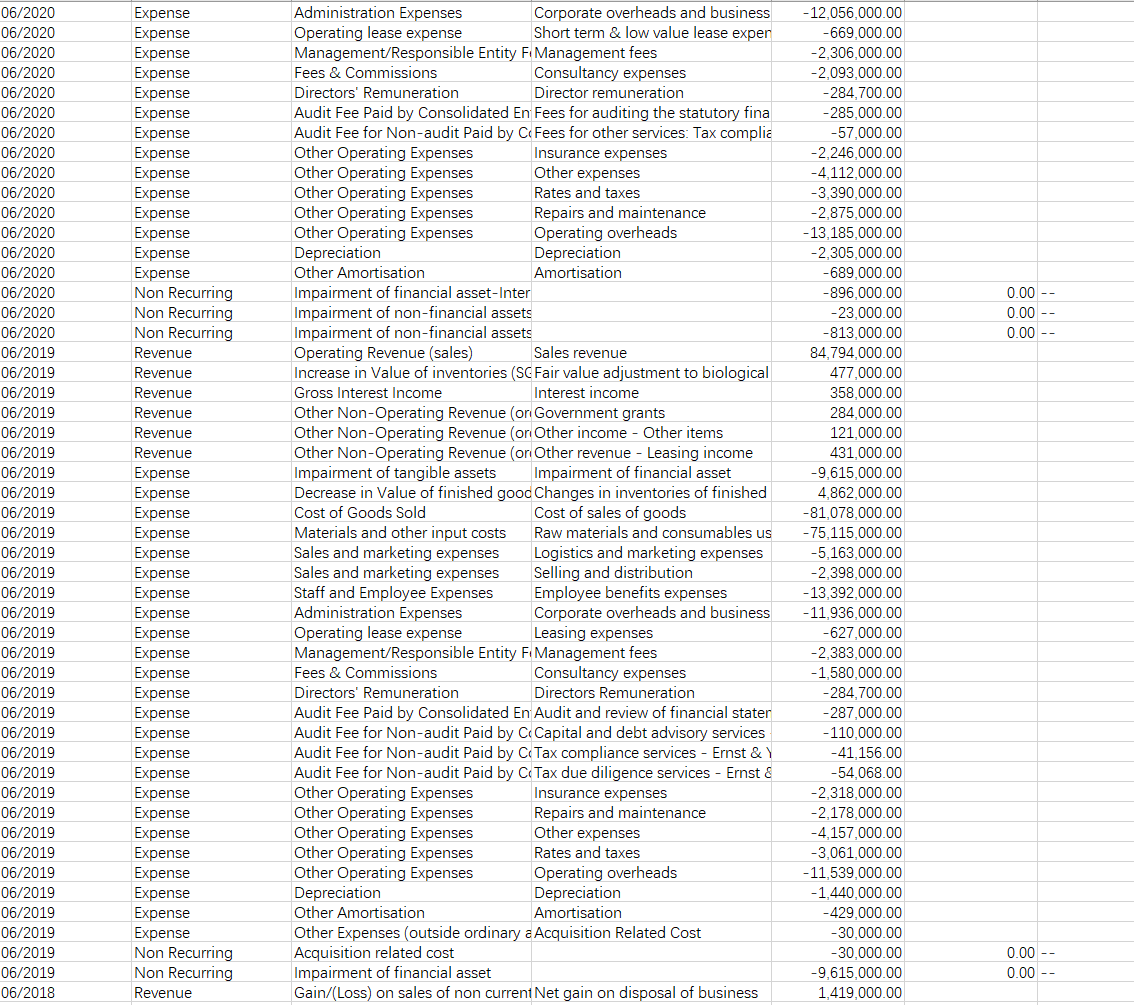
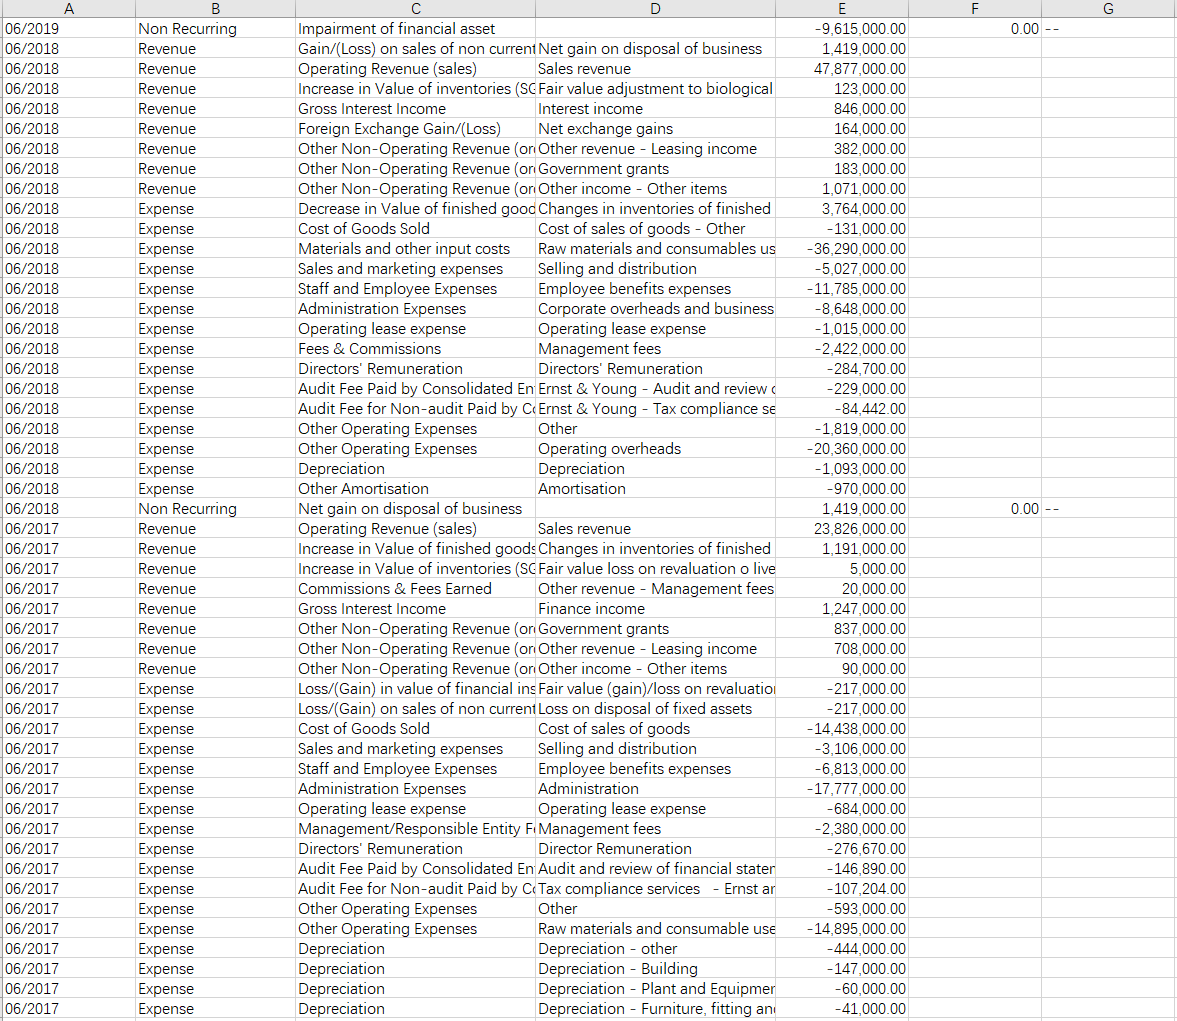

Profitability Ratios: 2019 2020 2021 Return on Equity Profit avail to owners/ Average Equity Answer: % Return on Assets: Net profit (loss) / Average total assets Answer: % Profit Margin Net profit (loss) / Sales Revenue (note used operating revenue) Answer: % Gross Profit Margin Gross profit / Sales Revenue (note used operating revenue) Answer: % Cash Flow to Sales Ratio Cash Flow from Operating Activities/ Sales Revenue (note used operating revenue) Answer: % 03/15 ' 0.00 0.00 Statement of Profit or Loss Operating Revenue Other Revenue Total Revenue Excluding Interest Operating Expenses EBITDA Depreciation Amortisation Depreciation and Amortisation EBIT Interest Revenue Interest Expense Net Interest Expense PreTax Profit Tax Expense Net Profit after Tax Before Abnormals Abnormals Abnormals Tax Net Abnormals Reported NPAT After Abnormals Outside Equity Interests Shares Outstanding at Period End Weighted Average Number of Shares EPS Adjusted (cents/share) EPS After Abnormals (cents/share) 06/16 15,999,000.00 5,985,000.00 21,984,000.00 -23,141,877.00 -1,157,877.00 -830,000.00 0.00 -830,000.00 -1,987,877.00 1,465,000.00 - 114,000.00 1,351,000.00 -636,877.00 209,000.00 -427,877.00 -1,292, 123.00 0.00 -1,292, 123.00 -1,720,000.00 4,000.00 363,241,052.00 317,839,878.00 -0.13 -0.54 06/17 23,826,000.00 2,851,000.00 26,677,000.00 -37,051,000.00 -10,374,000.00 -713,000.00 0.00 -713,000.00 -11,087,000.00 1.247,000.00 -172,000.00 1,075,000.00 - 10,012,000.00 2,005,000.00 -8,007,000.00 0.00 0.00 0.00 -8,007,000.00 258,000.00 433,315,877.00 425,631,252.00 -1.82 -1.82 06/18 47,877,000.00 3,342,000.00 51,219,000.00 -67,889,000.00 -16,670,000.00 -1,093,000.00 -970,000.00 -2,063,000.00 -18,733,000.00 846,000.00 -60,000.00 786,000.00 -17,947,000.00 3,435,000.00 -14,512,000.00 1,419,000.00 0.00 1,419,000.00 -13,093,000.00 499,000.00 443,315,867.00 443,315,867.00 -3.16 -2.84 06/19 84,794,000.00 1,313,000.00 86,107,000.00 -105,844,000.00 - 19,737,000.00 -1,440,000.00 -429,000.00 -1,869,000.00 -21,606,000.00 358,000.00 -1,646,000.00 -1,288,000.00 -22,894,000.00 5,224,000.00 -17,670,000.00 -9,645,000.00 0.00 -9,645,000.00 -27,315,000.00 340,000.00 443,315,867.00 443,315,867.00 -3.91 -6.08 06/20 103,028,000.00 5,263,000.00 108,291,000.00 - 119,305,000.00 -11,014,000.00 -2,305,000.00 -689,000.00 -2.994,000.00 -14,008,000.00 29,000.00 -1,606,000.00 -1,577,000.00 - 15,585,000.00 5,144,000.00 -10,441,000.00 -1,732,000.00 0.00 -1,732,000.00 -12,173,000.00 594,000.00 588,842,084.00 443,315,867.00 06/21 112.420.000.00 874,000.00 113,294,000.00 -136,750,000.00 -23,456,000.00 -2,618,000.00 -1,615,000.00 -4,233,000.00 -27,689,000.00 4,000.00 -690,000.00 -686,000.00 -28,375,000.00 7,389,000.00 -20,986,000.00 -885,000.00 0.00 -885,000.00 -21,871,000.00 50,000.00 842,674.408.00 644,707,646.00 -3.25 -3.38 0.00 0.00 0.00 0.00 0.00 0.00 0.00 363,241,052.00 0.00 0.00 0.00 -2.22 -2.61 03/15 34 390,000.00 13.707,000.00 8: 0.00 0.00 - 1.000.00 48,096,000.00 14.891.000.00 Statement of Financial Position CA - Cash CA - Receivables CA - Prepaid Expenses CA - Inventories CA - Investments CA - NCA Held Sale CA - Other Total Current Assets NCA - Receivables NCA - Inventories NCA - Investments NCA - PPSE NCA - Intangibles(EXGW) NCA - Goodwill NCA - Future Tax Benefit NCA - Other Total NCA Total Assets CL - Account Payable CL - Short-Term Debt CL - Provisions CL - NCL Held Sale CL - Other Total Curr. Liabilities NCL - Account Payable NCL - Long-Term Debt NCL - Provisions NCL - Other Total NCL Total Liabilities Share Capital Reserves Retained Earnings Other Equity Convertible Equity SE Held Sale Outside Equity Total Equity 03/15 34 390,000.00 13.707.000.00 0.00 0.00 0.00 0.00 - 1,000.00 48,096,000.00 0.00 3.893,000.00 14.891.000.00 37.780.000.00 9.245.000.00 0.00 2.602,000.00 0.00 68.411,000.00 116.507.000.00 41.000.00 0.00 0.00 0.00 0.00 41.000.00 0.00 0.00 0.00 2.830,000.00 2.830,000.00 2.871,000.00 118.954.000.00 0.00 -5.319.000.00 0.00 0.00 0.00 53,520,000.00 68,411,000.00 116,507.000.00 41,000.00 06/16 19.372.000.00 26.499,000.00 111,000.00 7.965,000.00 0.00 0.00 0.00 53.947.000.00 0.00 0.00 16.935.000.00 38.267.000.00 9.814,000.00 227.000.00 4,096,000.00 4.241,000.00 73.580.000.00 127.527.000.00 8.705.000.00 0.00 925,000.00 0.00 0.00 9.630,000.00 0.00 0.00 732.000.00 0.00 732.000.00 10.362,000.00 113.472.000.00 5.569.000.00 -2.819,000.00 0.00 0.00 0.00 943.000.00 117.165,000.00 06/17 28.702.000.00 14.498,000.00 4 107.000.00 11,660,000.00 0.00 1.999,000.00 0.00 60.966.000.00 977,000.00 4.400,000.00 16.275.000.00 44 224.000.00 11.721.000.00 1.847,000.00 5.899,000.00 0.00 85.343,000.00 146,309,000.00 9.818,000.00 0.00 137.000.00 0.00 0.00 9.955,000.00 0.00 0.00 2.214,000.00 0.00 2.214,000.00 12.169,000.00 147.535.000.00 -482.000.00 - 13,598,000.00 0.00 0.00 0.00 685,000.00 134 140,000.00 06/18 4.463.000.00 25.530.000.00 1.100.000.00 22.604.000.00 0.00 10.136.000.00 0.00 63.833,000.00 5.849,000.00 4.880,000.00 11.558,000.00 55.853.000.00 6.513,000.00 1.847,000.00 8.351.000.00 0.00 94.851.000.00 158.684.000.00 14.027,000.00 21.285.000.00 275,000.00 0.00 0.00 35.587.000.00 0.00 159.000.00 1.646,000.00 0.00 1.805.000.00 37.392.000.00 147,535,000.00 - 237,000.00 -26.192.000.00 0.00 0.00 0.00 186.000.00 121.292.000.00 06/19 1.920,000.00 14.562,000.00 1.178,000.00 14 192.000.00 0.00 0.00 0.00 31.852,000.00 0.00 5.303,000.00 0.00 68.168.000.00 11.278,000.00 8.159,000.00 15.802.000.00 0.00 108.710.000.00 140.562,000.00 15,689,000.00 5,516,000.00 473,000.00 0.00 0.00 21,678,000.00 0.00 35.807.000.00 2.964,000.00 0.00 38.771,000.00 60.449,000.00 147.535,000.00 -9.135.000.00 -58.133.000.00 0.00 0.00 0.00 - 154.000.00 80.113,000.00 06/20 10.556.000.00 11.921,000.00 1.365.000.00 12.631,000.00 0.00 38.565.000.00 0.00 75.038.000.00 150,000.00 0.00 0.00 42.073.000.00 1.230,000.00 7.404,000.00 19.453.000.00 0.00 70.310.000.00 145,348,000.00 13.784.000.00 26,221,000.00 585,000.00 0.00 0.00 40.590,000.00 0.00 23.429,000.00 1.344.000.00 0.00 24.773.000.00 65.363.000.00 159.337.000.00 -8.892.000.00 -69.712,000.00 0.00 0.00 0.00 -748,000.00 79.985,000.00 705,204,000.00 922.000.00 16.731.000.00 2.021,000.00 18.874,000.00 1.200,000.00 0.00 0.00 39.748,000.00 150,000.00 0.00 0.00 55,698,000.00 1.162,000.00 5.919.000.00 27.506,000.00 0.00 90.435,000.00 130.183.000.00 18.439,000.00 1.529,000.00 789.000.00 0.00 0.00 20.757,000.00 0.00 31.709,000.00 1.823,000.00 0.00 33,532,000.00 54.289.000.00 174.636,000.00 -6.411.000.00 91.533,000.00 0.00 0.00 0.00 - 798,000.00 75.894,000.00 0.00 0.00 0.00 41.000.00 0.00 2.830.000.00 2.830,000.00 2.871,000.00 118.954.000.00 0.00 -5,319,000.00 0.00 0.00 0.00 113.635.000.00 113.635.000.00 03/15 03/15 Statement of Cash Flow Receipts from Customers Payments to Suppliers and Employees Dividends Received Interest Received Interest Paid Tax Paid Other Operating Cashflows Net Operating Cashflows Payment for Purchase of PPE Proceeds From Sale of PPE Investments Purchased Proceeds From Sale of Investments Payments for Purchase of Subsidiaries Proceeds from Sale of Subsidiaries Loans Granted Loans Repaid Other Investing Cashflows Net Investing Cashflows Proceeds from Issues Proceeds from Borrowings Repayment of Borrowings Dividends Paid Other Financing Cashflows Net Financing Cashflows Net Increase in Cash Cash at Beginning of Period Exchange Rate Adj Other Cash Adjustments Cash at End of Period 06/16 6,478,000.00 -23,427,000.00 0.00 1,233,000.00 0.00 0.00 -990,000.00 - 16,706,000.00 -7,342,000.00 -14, 314,000.00 -15,400,000.00 0.00 -27,098,000.00 0.00 0.00 0.00 180,000.00 -63,974,000.00 100,000,000.00 0.00 06/17 34,497,000.00 -46,373,000.00 0.00 801,000.00 -145,000.00 -367,000.00 0.00 -11,587,000.00 -9,912,000.00 0.00 0.00 4,737,000.00 -764,000.00 0.00 -250,000.00 0.00 61,000.00 -6.128,000.00 28,823,000.00 66,000.00 0.00 -2,179,000.00 804,000.00 27,514,000.00 9,799,000.00 19,372,000.00 -469,000.00 0.00 28,702,000.00 06/18 48,043,000.00 - 77,945,000.00 0.00 185,000.00 -60,000.00 0.00 0.00 -29,777,000.00 -14,383,000.00 1,998,000.00 0.00 0.00 0.00 -104,000.00 -4,270,000.00 0.00 -357,000.00 -17,116,000.00 0.00 21,444,000.00 0.00 0.00 891,000.00 22,335,000.00 -24,558,000.00 28,702,000.00 319,000.00 0.00 4,463,000.00 06/19 87,415,000.00 -95,275,000.00 0.00 358,000.00 -1,612,000.00 0.00 0.00 -9.114,000.00 -12,772,000.00 0.00 0.00 0.00 0.00 0.00 0.00 0.00 -275,000.00 -13,047,000.00 0.00 19,847,000.00 0.00 0.00 0.00 19,847,000.00 -2,314,000.00 4,463,000.00 -229,000.00 0.00 1,920,000.00 06/20 105,618,000.00 -117,763,000.00 0.00 29,000.00 -1,590,000.00 0.00 0.00 -13.706.000.00 -5,973,000.00 8,315,000.00 0.00 0.00 0.00 0.00 0.00 0.00 689,000.00 3,031,000.00 11,546,000.00 12,256,000.00 -4,500,000.00 0.00 81,000.00 19,383,000.00 8,708,000.00 1,920,000.00 -72,000.00 0.00 10,556,000.00 06/21 106,761,000.00 - 137,414,000.00 0.00 4.000.00 -622,000.00 0.00 0.00 -31,271,000.00 -16,559,000.00 39,004,000.00 0.00 0.00 0.00 0.00 0.00 0.00 280,000.00 22,725,000.00 15,299,000.00 4,105,000.00 -20,517,000.00 0.00 156,000.00 -957,000.00 -9,503,000.00 10,556,000.00 -31,000.00 0.00 1,022,000.00 -- 0.00 0.00 0.00 0.00 0.00 0.00 0.00 0.00 0.00 0.00 0.00 0.00 0.00 0.00 -7,499,000.00 92,501,000.00 11,821,000.00 7,547,000.00 4,000.00 0.00 19,372,000.00 -- Tax Notes Year 06/2021 06/2021 06/2021 06/2021 06/2021 06/2021 06/2021 06/2021 06/2021 06/2021 06/2021 06/2021 06/2021 06/2021 06/2021 06/2021 06/2021 06/2021 06/2021 06/2021 06/2021 06/2021 06/2021 06/2021 06/2021 06/2021 06/2021 06/2021 06/2021 06/2021 06/2021 06/2021 06/2021 06/2021 06/2020 06/2020 06/2020 06/2020 06/2020 06/2020 06/2020 06/2020 06/2020 06/2020 06/2020 06/2020 06/2020 06/2020 06/2020 Data Set Revenue Revenue Revenue Revenue Revenue Revenue Expense Expense Expense Expense Expense Expense Expense Expense Expense Expense Expense Expense Expense Expense Expense Expense Expense Expense Expense Expense Expense Expense Expense Expense Expense Expense Non Recurring Non Recurring Revenue Revenue Revenue Revenue Revenue Revenue Revenue Expense Expense Expense Expense Expense Expense Expense Expense Items Item BreakDown Operating Revenue (sales) Sales revenue Commissions & Fees Earned Reversal of prior year impairmento Gross Interest Income Interest income Other Non-Operating Revenue (or Government grants Other Non-Operating Revenue (or Other revenue - Leasing income Other Non-Operating Revenue (or Other income - Other items Impairment of tangible assets Impairment of non-financial assets Decrease in Value of finished good Changes in inventories of finished Cost of Goods Sold Cost of sales of goods Cost of Goods Sold Raw materials and consumables us Sales and marketing expenses Logistics and marketing expenses Sales and marketing expenses Selling and distribution Staff and Employee Expenses Employee benefits expenses Administration Expenses Corporate overheads and business Operating lease expense Short term & low value lease expen Management/Responsible Entity F. Management fees Fees & Commissions Consultancy expenses Directors' Remuneration Director remuneration Other Operating Expenses Operating overheads Other Operating Expenses Other expenses Other Operating Expenses Other expenses Other Operating Expenses Internalisation of IMA Other Operating Expenses Rates and taxes Other Operating Expenses Insurance expenses Other Operating Expenses Repairs and maintenance Depreciation Depreciation Expense - Leases Depreciation Buildings Depreciation Plant and equipment Depreciation Furniture, fittings and equipment Depreciation Motor vehicles Other Amortisation Internally generated software Other Amortisation Customer contracts Impairment of non-financial assets Reversal of prior year impairmento Gain/(Loss) on sales of non current Net gain on disposal of assets Operating Revenue (sales) Sales revenue Increase in Value of inventories (SC Fair value adjustment to biological Gross Interest Income Interest income Other Non-Operating Revenue (or Other income - Other items Other Non-Operating Revenue (on Government grants Other Non-Operating Revenue (or Other revenue - Leasing income Impairment of tangible assets Impairment of non-financial assets Impairment of tangible assets Impairment of non-financial assets Impariment of intangible assets Impairment of financial asset-Inter Decrease in Value of finished good Changes in inventories of finished Cost of Goods Sold Raw materials and consumables us Cost of Goods Sold Cost of sales of goods Sales and marketing expenses Selling and distribution Sales and marketing expenses Logistics and marketing expenses Values 112,420,000.00 600,000.00 4,000.00 193,000.00 48,000.00 33,000.00 -1,485,000.00 10,267,000.00 -110,641,000.00 -104,068,000.00 -8,775,000.00 -3,766,000.00 - 15,542,000.00 -10,593,000.00 -467,000.00 -1,445,000.00 -1,980,000.00 -260,000.00 -12,218,000.00 -91,000.00 -3,724,000.00 -3,074,000.00 -3,686,000.00 -2,578,000.00 -2.219,000.00 -156,000.00 -7,000.00 -2,318,000.00 -49,000.00 -88,000.00 - 167,000.00 -1,448,000.00 -1,485,000.00 600,000.00 2,445,000.00 103,028,000.00 1,282,000.00 29,000.00 1,074,000.00 320,000.00 142,000.00 -813,000.00 -23,000.00 -896,000.00 10,216,000.00 -90,968,000.00 -93,872,000.00 -3.186.000.00 -6,653,000.00 0.00 0.00 0.00 0.00 0.00 -- 06/2020 06/2020 06/2020 06/2020 06/2020 06/2020 06/2020 06/2020 06/2020 06/2020 06/2020 06/2020 06/2020 06/2020 06/2020 06/2020 06/2020 06/2019 06/2019 06/2019 06/2019 06/2019 06/2019 06/2019 06/2019 06/2019 06/2019 06/2019 06/2019 06/2019 06/2019 06/2019 06/2019 06/2019 06/2019 06/2019 06/2019 06/2019 06/2019 06/2019 06/2019 06/2019 06/2019 06/2019 06/2019 06/2019 06/2019 06/2019 06/2019 06/2018 Expense Expense Expense Expense Expense Expense Expense Expense Expense Expense Expense Expense Expense Expense Non Recurring Non Recurring Non Recurring Revenue Revenue Revenue Revenue Revenue Revenue Expense Expense Expense Expense Expense Expense Expense Expense Expense Expense Expense Expense Expense Expense Expense Expense Expense Expense Expense Expense Expense Expense Expense Expense Non Recurring Non Recurring Revenue Administration Expenses Corporate overheads and business Operating lease expense Short term & low value lease expen Management/Responsible Entity F Management fees Fees & Commissions Consultancy expenses Directors' Remuneration Director remuneration Audit Fee Paid by Consolidated En Fees for auditing the statutory fina Audit Fee for Non-audit Paid by C Fees for other services: Tax complia Other Operating Expenses Insurance expenses Other Operating Expenses Other expenses Other Operating Expenses Rates and taxes Other Operating Expenses Repairs and maintenance Other Operating Expenses Operating overheads Depreciation Depreciation Other Amortisation Amortisation Impairment of financial asset-Inter Impairment of non-financial assets Impairment of non-financial assets Operating Revenue (sales) Sales revenue Increase in Value of inventories (SC Fair value adjustment to biological Gross Interest Income Interest income Other Non-Operating Revenue (or Government grants Other Non-Operating Revenue (or Other income - Other items Other Non-Operating Revenue (on Other revenue - Leasing income Impairment of tangible assets Impairment of financial asset Decrease in Value of finished good Changes in inventories of finished Cost of Goods Sold Cost of sales of goods Materials and other input costs Raw materials and consumables us Sales and marketing expenses Logistics and marketing expenses Sales and marketing expenses Selling and distribution Staff and Employee Expenses Employee benefits expenses Administration Expenses Corporate overheads and business Operating lease expense Leasing expenses Management/Responsible Entity F. Management fees Fees & Commissions Consultancy expenses Directors' Remuneration Directors Remuneration Audit Fee Paid by Consolidated En Audit and review of financial stater Audit Fee for Non-audit Paid by C Capital and debt advisory services Audit Fee for Non-audit Paid by C Tax compliance services - Ernst & Y Audit Fee for Non-audit Paid by CTax due diligence services - Ernst & Other Operating Expenses Insurance expenses Other Operating Expenses Repairs and maintenance Other Operating Expenses Other expenses Other Operating Expenses Rates and taxes Other Operating Expenses Operating overheads Depreciation Depreciation Other Amortisation Amortisation Other Expenses (outside ordinary a Acquisition Related Cost Acquisition related cost Impairment of financial asset Gain/(Loss) on sales of non current Net gain on disposal of business - 12,056,000.00 -669,000.00 -2,306,000.00 -2,093,000.00 - 284,700.00 -285,000.00 -57,000.00 -2.246,000.00 -4,112,000.00 -3,390,000.00 -2,875,000.00 -13,185,000.00 -2,305,000.00 -689,000.00 -896,000.00 -23,000.00 -813,000.00 84,794,000.00 477,000.00 358,000.00 284,000.00 121,000.00 431,000.00 -9,615,000.00 4,862,000.00 -81,078,000.00 -75, 115,000.00 -5,163,000.00 -2,398,000.00 -13,392,000.00 -11,936,000.00 -627,000.00 -2,383,000.00 -1,580,000.00 -284,700.00 -287,000.00 -110,000.00 -41,156.00 -54,068.00 -2,318,000.00 -2,178,000.00 -4,157,000.00 -3,061,000.00 -11,539,000.00 -1.440,000.00 -429,000.00 -30,000.00 -30,000.00 -9,615,000.00 1,419,000.00 0.00 0.00 F G 0.00 -- 06/2019 06/2018 06/2018 06/2018 06/2018 06/2018 06/2018 06/2018 06/2018 06/2018 06/2018 06/2018 06/2018 06/2018 06/2018 06/2018 06/2018 06/2018 06/2018 06/2018 06/2018 06/2018 06/2018 06/2018 06/2018 06/2017 06/2017 06/2017 06/2017 06/2017 06/2017 06/2017 06/2017 06/2017 06/2017 06/2017 06/2017 06/2017 06/2017 06/2017 06/2017 06/2017 06/2017 06/2017 06/2017 06/2017 06/2017 06/2017 06/2017 06/2017 B Non Recurring Revenue Revenue Revenue Revenue Revenue Revenue Revenue Revenue Expense Expense Expense Expense Expense Expense Expense Expense Expense Expense Expense Expense Expense Expense Expense Non Recurring Revenue Revenue Revenue Revenue Revenue Revenue Revenue Revenue Expense Expense Expense Expense Expense Expense Expense Expense Expense Expense Expense Expense Expense Expense Expense Expense Expense C D Impairment of financial asset Gain/(Loss) on sales of non current Net gain on disposal of business Operating Revenue (sales) Sales revenue Increase in Value of inventories (SC Fair value adjustment to biological Gross Interest Income Interest income Foreign Exchange Gain/(Loss) Net exchange gains Other Non-Operating Revenue (or Other revenue - Leasing income Other Non-Operating Revenue (or Government grants Other Non-Operating Revenue (or Other income - Other items Decrease in Value of finished good Changes in inventories of finished Cost of Goods Sold Cost of sales of goods - Other Materials and other input costs Raw materials and consumables us Sales and marketing expenses Selling and distribution Staff and Employee Expenses Employee benefits expenses Administration Expenses Corporate overheads and business Operating lease expense Operating lease expense Fees & Commissions Management fees Directors' Remuneration Directors' Remuneration Audit Fee Paid by Consolidated En Ernst & Young - Audit and review Audit Fee for Non-audit Paid by C Ernst & Young - Tax compliance se Other Operating Expenses Other Other Operating Expenses Operating overheads Depreciation Depreciation Other Amortisation Amortisation Net gain on disposal of business Operating Revenue (sales) Sales revenue Increase in Value of finished goods Changes in inventories of finished Increase in Value of inventories (SC Fair value loss on revaluation o live Commissions & Fees Earned Other revenue - Management fees Gross Interest Income Finance income Other Non-Operating Revenue (or Government grants Other Non-Operating Revenue (or Other revenue - Leasing income Other Non-Operating Revenue (or Other income - Other items Loss/(Gain) in value of financial ins Fair value (gain)/loss on revaluation Loss/(Gain) on sales of non current Loss on disposal of fixed assets Cost of Goods Sold Cost of sales of goods Sales and marketing expenses Selling and distribution Staff and Employee Expenses Employee benefits expenses Administration Expenses Administration Operating lease expense Operating lease expense Management/Responsible Entity Fi Management fees Directors' Remuneration Director Remuneration Audit Fee Paid by Consolidated En Audit and review of financial stater Audit Fee for Non-audit Paid by CTax compliance services - Ernst ar Other Operating Expenses Other Other Operating Expenses Raw materials and consumable use Depreciation Depreciation - other Depreciation Depreciation - Building Depreciation Depreciation - Plant and Equipmer Depreciation Depreciation - Furniture, fitting an E -9,615,000.00 1,419,000.00 47,877,000.00 123,000.00 846,000.00 164,000.00 382,000.00 183,000.00 1,071,000.00 3,764,000.00 - 131,000.00 -36,290,000.00 -5,027,000.00 -11,785,000.00 -8,648,000.00 -1,015,000.00 -2,422,000.00 -284,700.00 -229,000.00 -84.442.00 -1,819,000.00 -20,360,000.00 -1,093,000.00 -970,000.00 1,419,000.00 23,826,000.00 1,191,000.00 5,000.00 20,000.00 1,247,000.00 837,000.00 708,000.00 90,000.00 -217,000.00 -217,000.00 -14,438,000.00 -3,106,000.00 -6,813,000.00 -17,777,000.00 -684,000.00 -2,380,000.00 -276,670.00 -146,890.00 -107,204.00 -593,000.00 -14,895,000.00 -444,000.00 -147,000.00 -60,000.00 -41,000.00 0.00 -- 06/2017 06/2017 06/2017 06/2017 Expense Expense Expense Expense Depreciation Depreciation Depreciation Depreciation Depreciation - Building Depreciation - Plant and Equipmer Depreciation - Furniture, fitting an Depreciation - Motor vehicle -147,000.00 -60,000.00 -41,000.00 -21,000.00
 Please answer the question in the imagine or screenshot an excel table. thx


