Answered step by step
Verified Expert Solution
Link Copied!

Question

1 Approved Answer

Please answer this 22. Smoking rates for adult males in North American countries are shown below: Canada 22% United States 24.1% Mexico 35.9% a) The

Please answer this
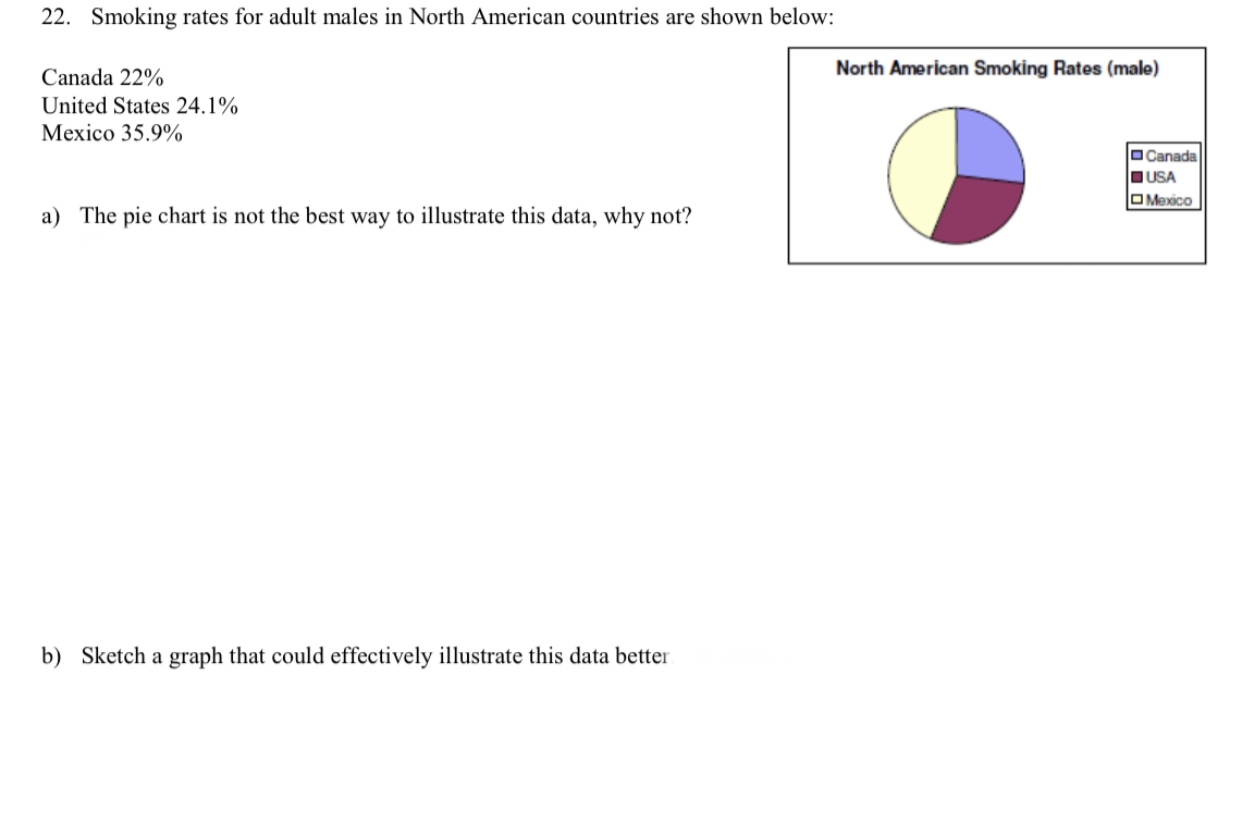
image text in transcribed
22. Smoking rates for adult males in North American countries are shown below: Canada 22% United States 24.1% Mexico 35.9% a) The pie chart is not the best way to illustrate this data, why not? b) Sketch a graph that could effectively illustrate this data better

Step by Step Solution

There are 3 Steps involved in it

Step: 1

blur-text-image

Get Instant Access to Expert-Tailored Solutions

See step-by-step solutions with expert insights and AI powered tools for academic success

Step: 2

blur-text-image_2

Step: 3

blur-text-image_3

Ace Your Homework with AI

Get the answers you need in no time with our AI-driven, step-by-step assistance

Get Started

Recommended Textbook for

Intermediate Algebra With Trigonometry

Authors: Charles P McKeague

1st Edition

1483218759, 9781483218755

More Books

Students also viewed these Mathematics questions

Question

What is quality of work life ?

Answered: 1 week ago

Question

What is meant by Career Planning and development ?

Answered: 1 week ago

Question

What are Fringe Benefits ? List out some.

Answered: 1 week ago

Question

How autonomous should the target be left after the merger deal?

Answered: 1 week ago